The narrative de jour scaring bond investors is reflation. The recent stickiness and even uptick in prices have investors worried that inflation is headed higher again. The concern is not without merit, as several items in the inflation reports are increasing in price. However, before buying into the narrative, we want to share our research that argues CPI could be much lower in the coming nine months to a year.
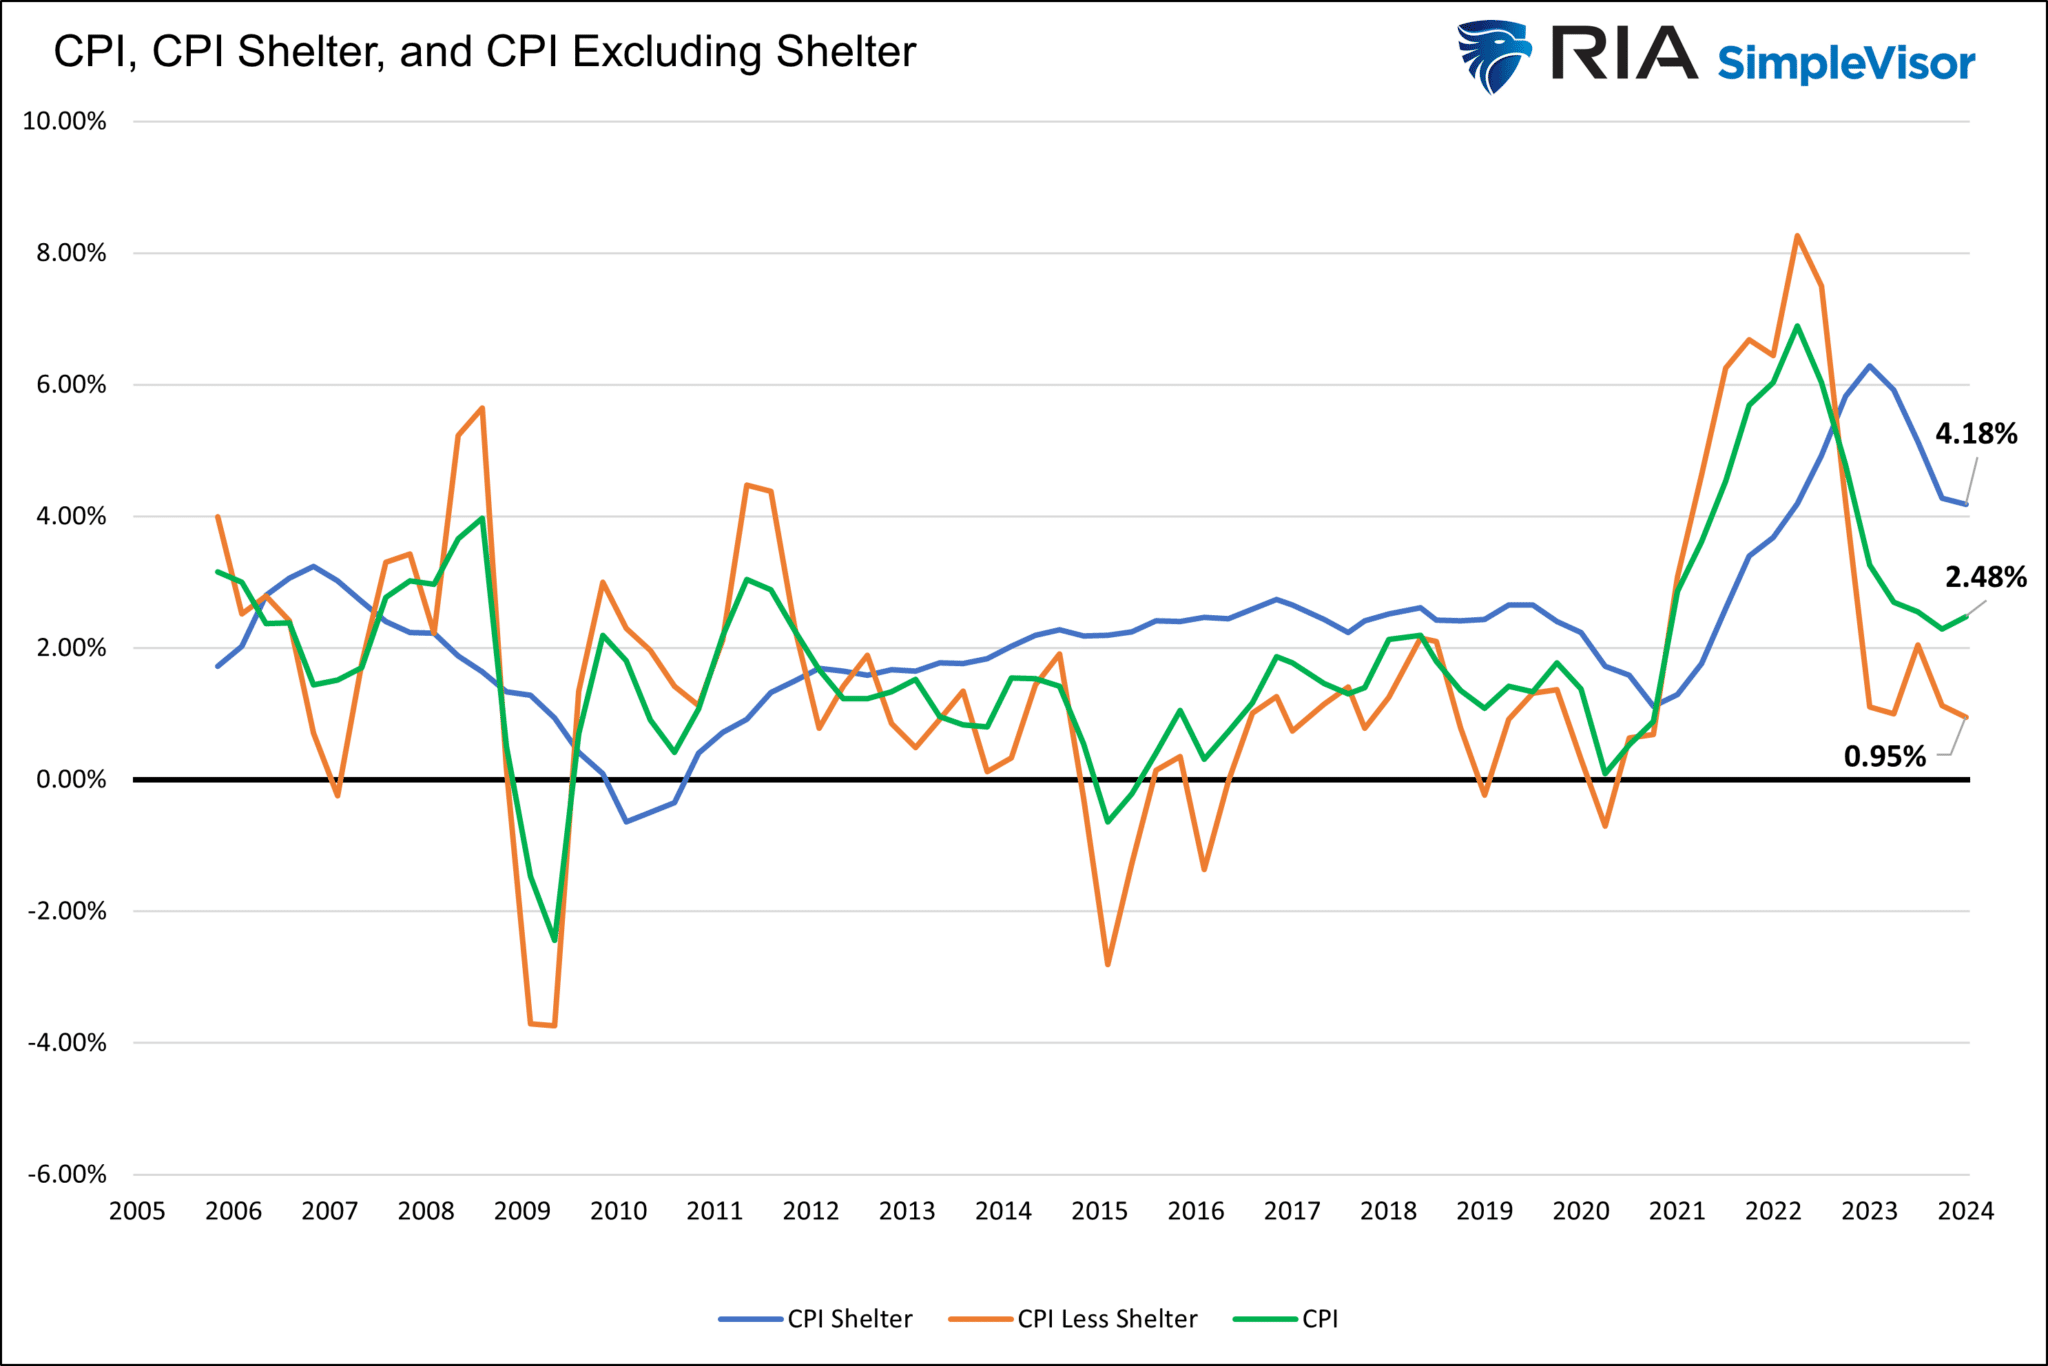
We have often written about how the surge in shelter costs within the CPI inflation calculation grossly distorts CPI. The problem is not necessarily whether shelter costs, primarily rent and imputed rent, should be over a third of CPI. Instead, we bemoan the lagging nature of the BLS’ CPI shelter data. The price of bread, cell phones, and every other good and service in CPI is based on current prices. Rents, however, are based on surveys. Given that only about 1/12ths of rents are reset in any given month, 11/12ths of the data is old. Unlike the prices of other goods and services, the BLS effectively uses rent and imputed rental prices that are about six months stale on average.
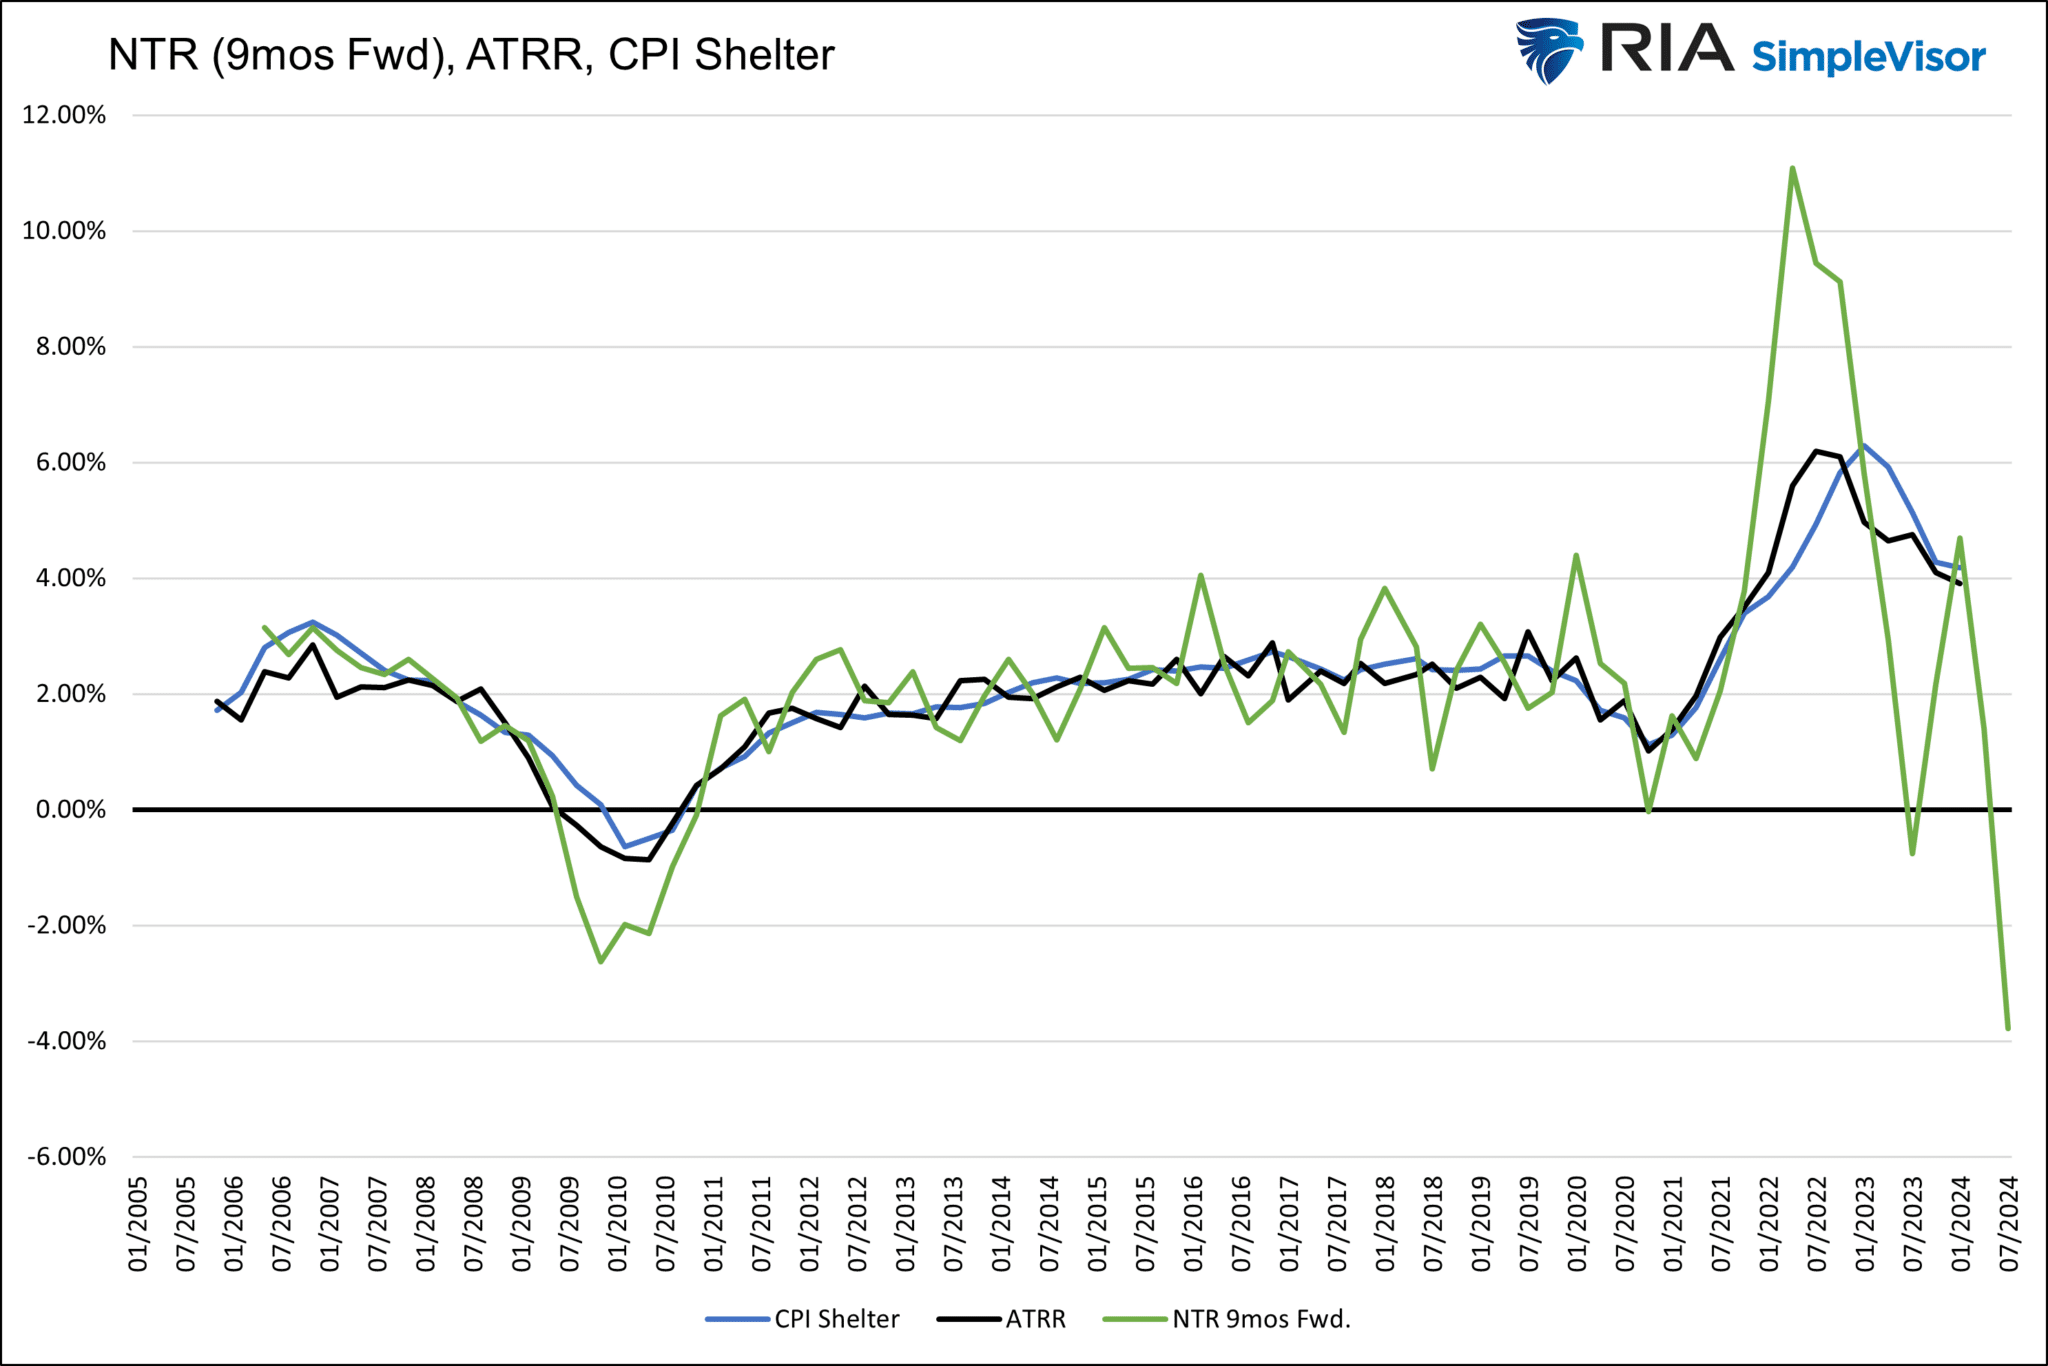
With this lag in mind, we focus on the Cleveland Fed’s All Tenants Regressed Rent Index (ATRR) and its New Tenant Rent Index (NTR) along with the BLS’ CPI, CPI-Shelter, and CPI-less Shelter. Our analysis of this data exposes the lag and, more importantly, forecasts how current rental prices will impact CPI later this year. For starters, we share the graph below. CPI Shelter costs are well above CPI, and CPI excluding Shelter Costs are below CPI. After the Market Update below, we continue this discussion.
What To Watch Today
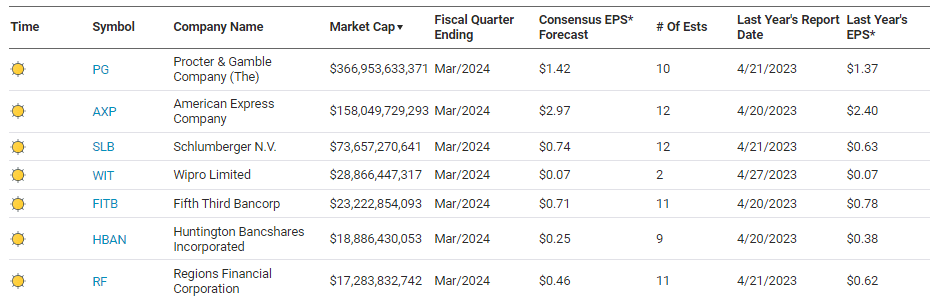
Earnings
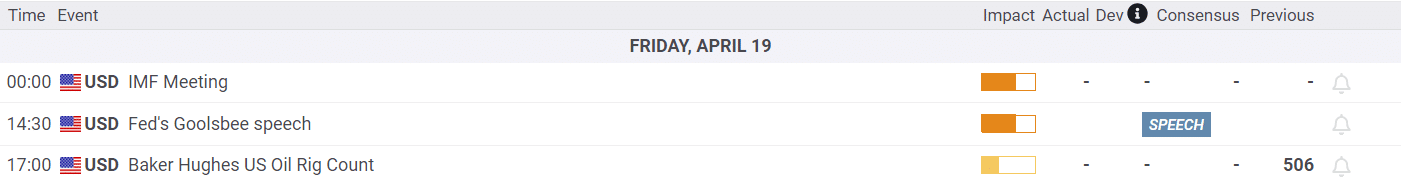
Economy
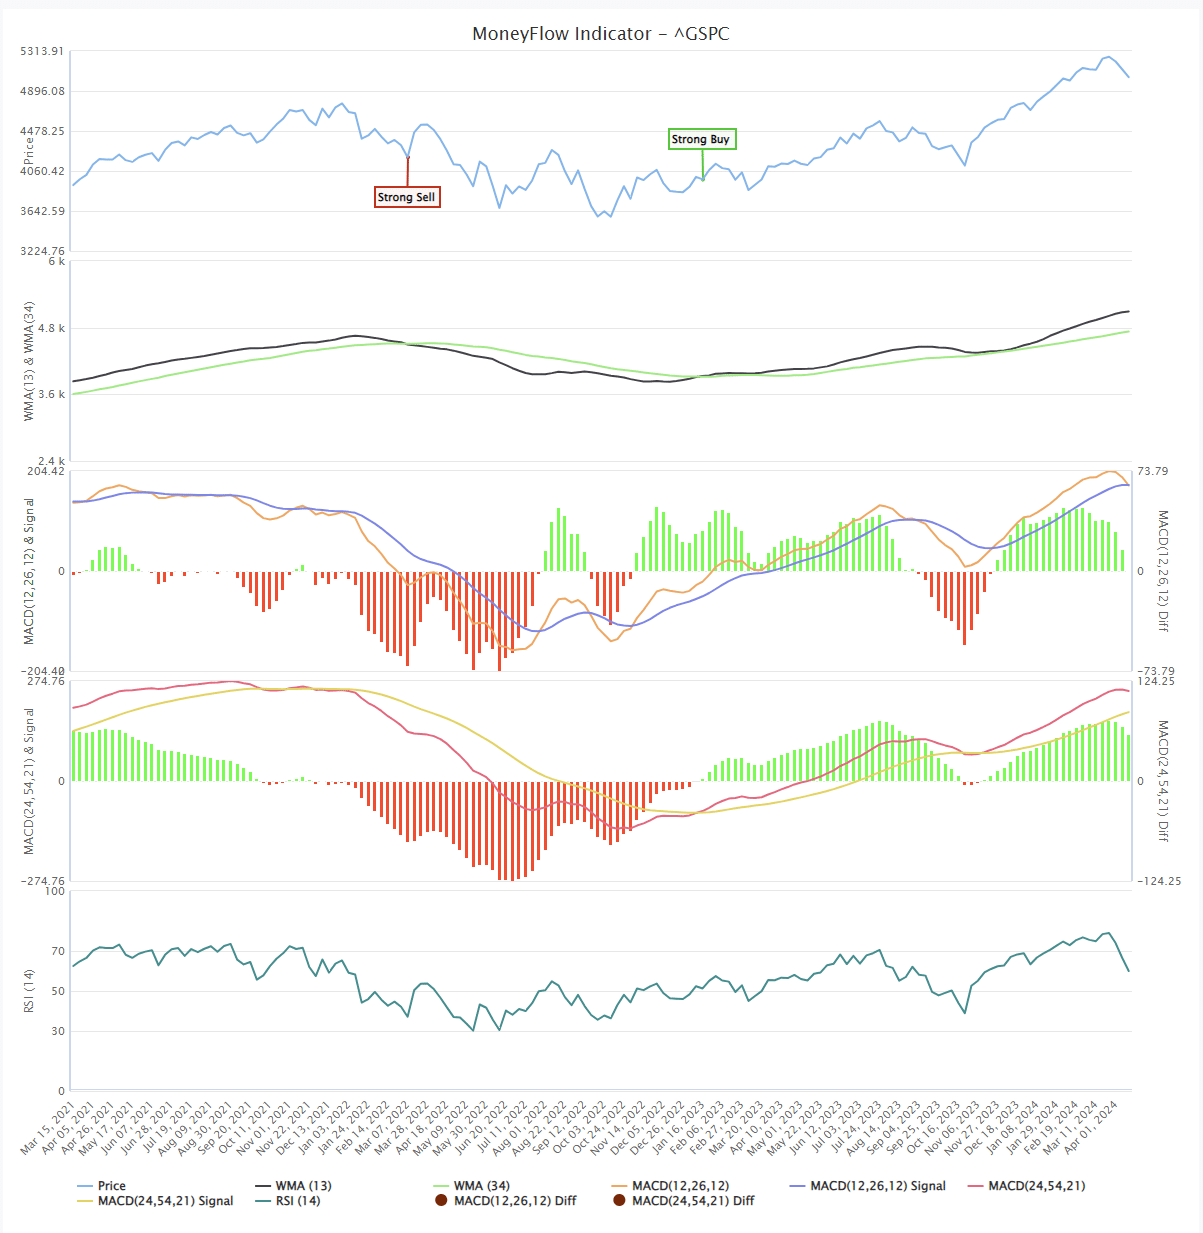
Market Trading Update
As noted yesterday, the market has been under decent selling pressure and declined for four consecutive days. With markets decently oversold, yesterday’s early bounce was unsurprising, but, as has been the case over the last several days, the rally failed. Notably, however, the market did close off the lows after an initial test of the 23.6% retracement from the previous peak. The market is oversold enough for a reflexive bounce that could last a few days. However, with the MACD on a solid “sell signal,” we should suggest using rallies to rebalance equity risk until a new “buy signal” is triggered.
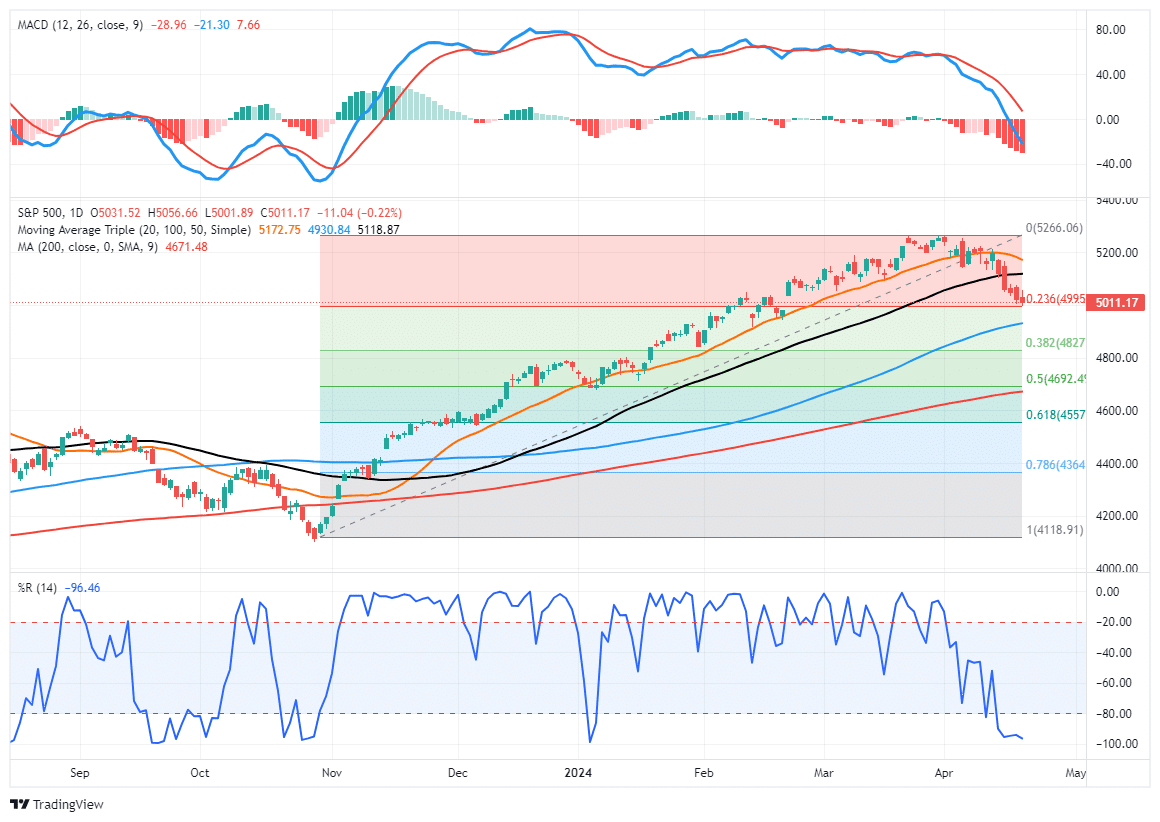
The one thing to note is that the WEEKLY money flow signal is close to triggering a “sell signal.” The last time the weekly signal was triggered was in August of last year, preceding the sell-off into October. That signal suggests that we are likely not done with the current correction process, so we will want to navigate markets carefully until we know.

Shelter Costs Are Headed Lower
The graph below charts the Cleveland Fed’s Average Tenant Rentals (ATRR) and their New Tenant Rentals (NTR) alongside BLS CPI-Shelter. We pushed the NTR data forward nine months to better show how well it leads the ATRR and CPI Shelter prices. There are a few essential takeaways from the graph. First, the ATRR and CPI-Shelter are nearly identical. Second, NTR is more volatile than the other two rent indicators because it’s not an average. Third, and most importantly, NTR tends to lead CPI Shelter and ATRR by nine months.
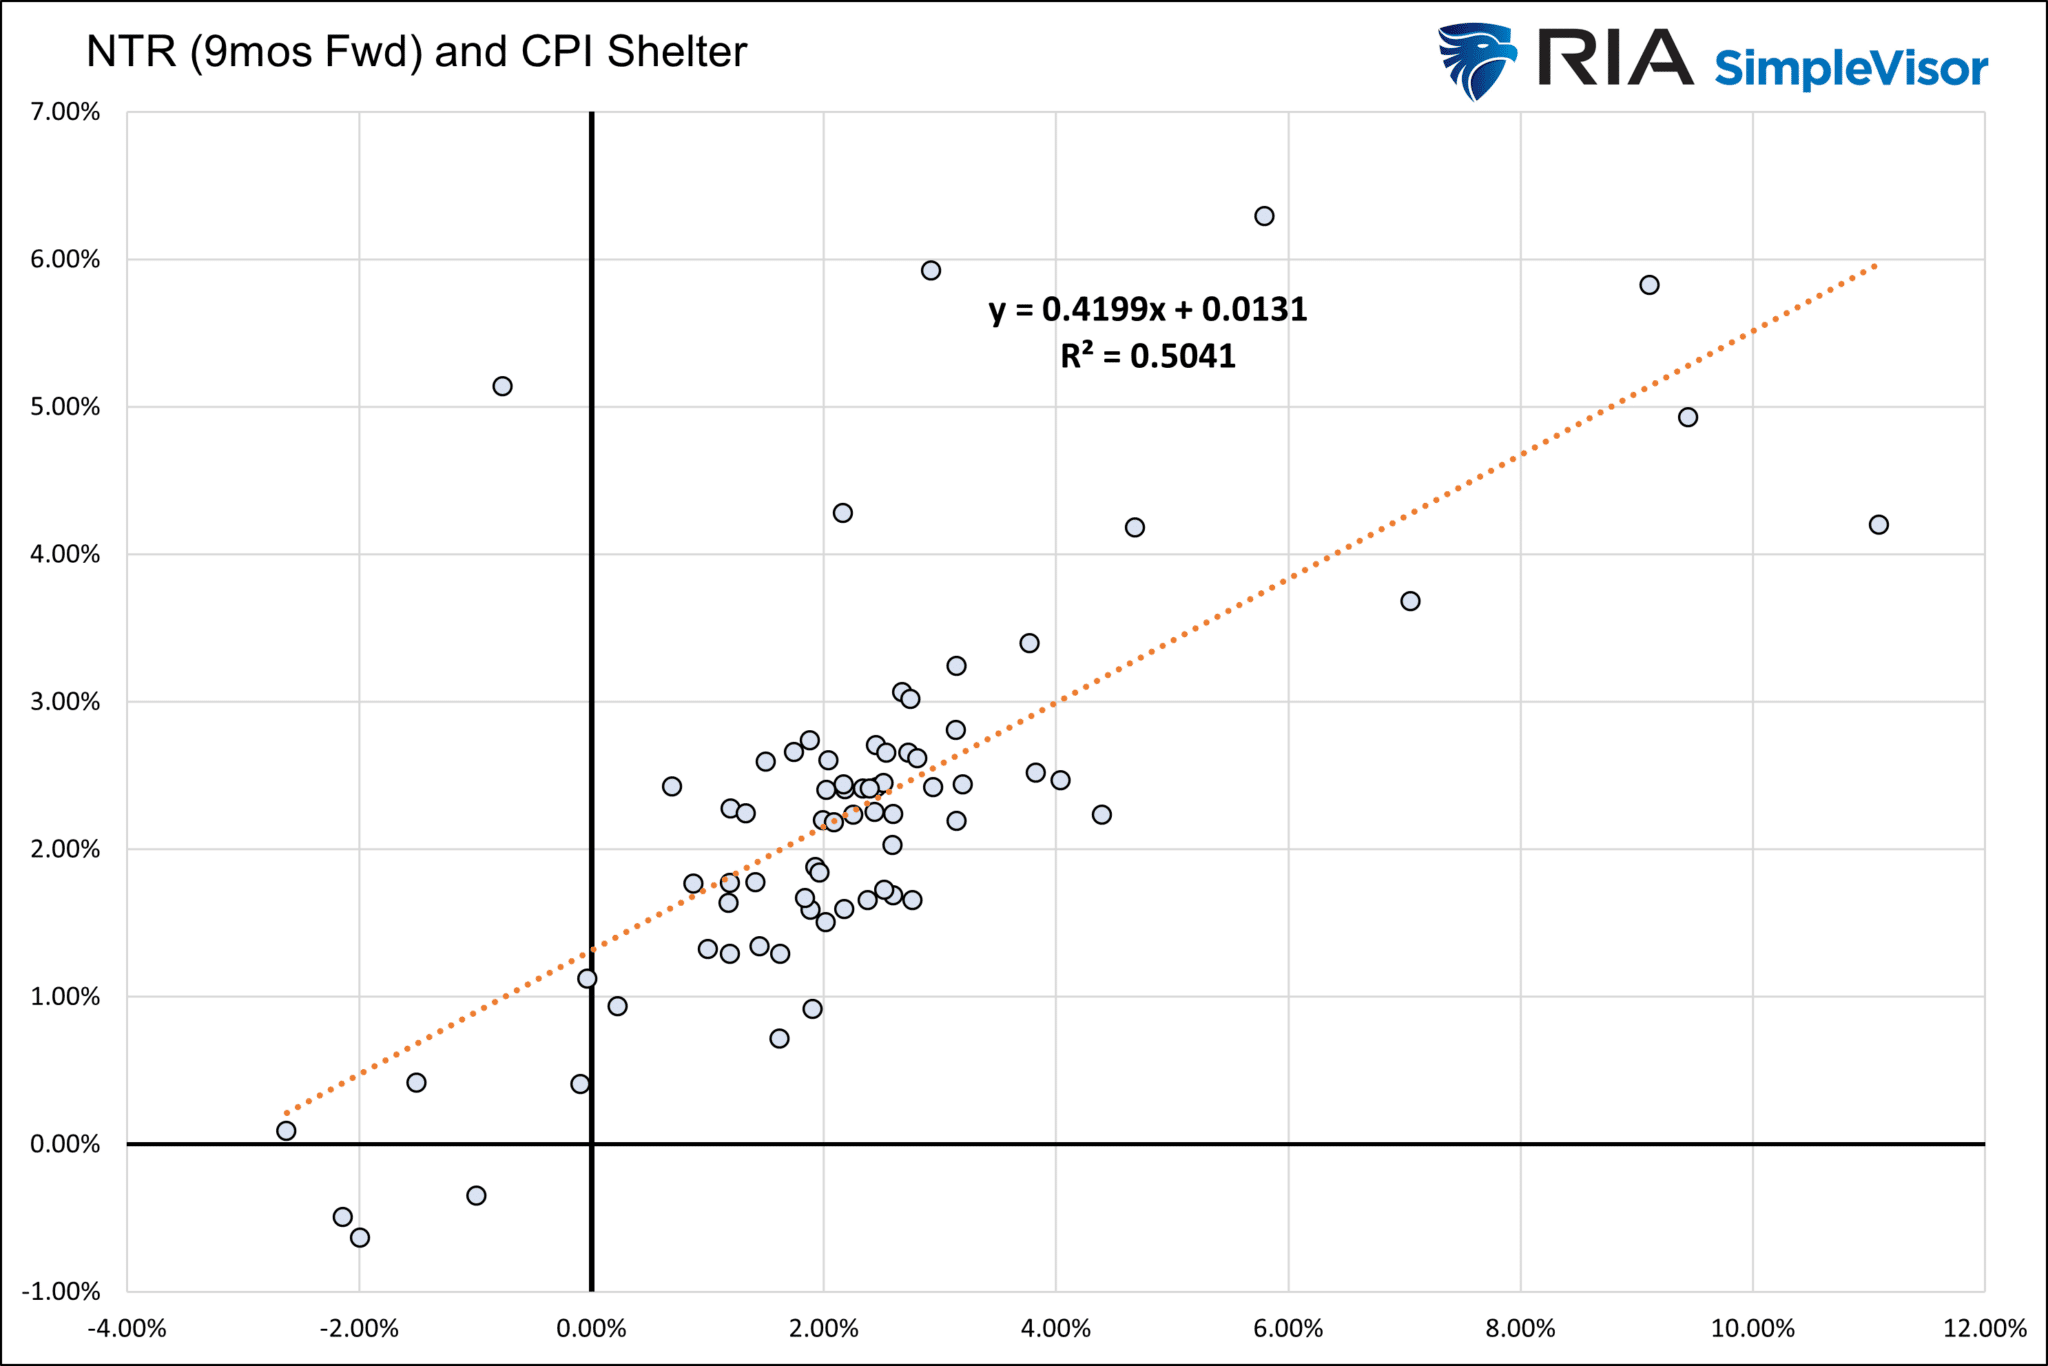
The scatter plot below highlights the strong correlation between NTR nine months in advance and CPI Shelter. The outliers are a function of the volatility of the NTR data. If we presume the relationship holds and, to be conservative, ATR is closer to zero than negative, we should expect inflation to be nearing 2% by year-end.
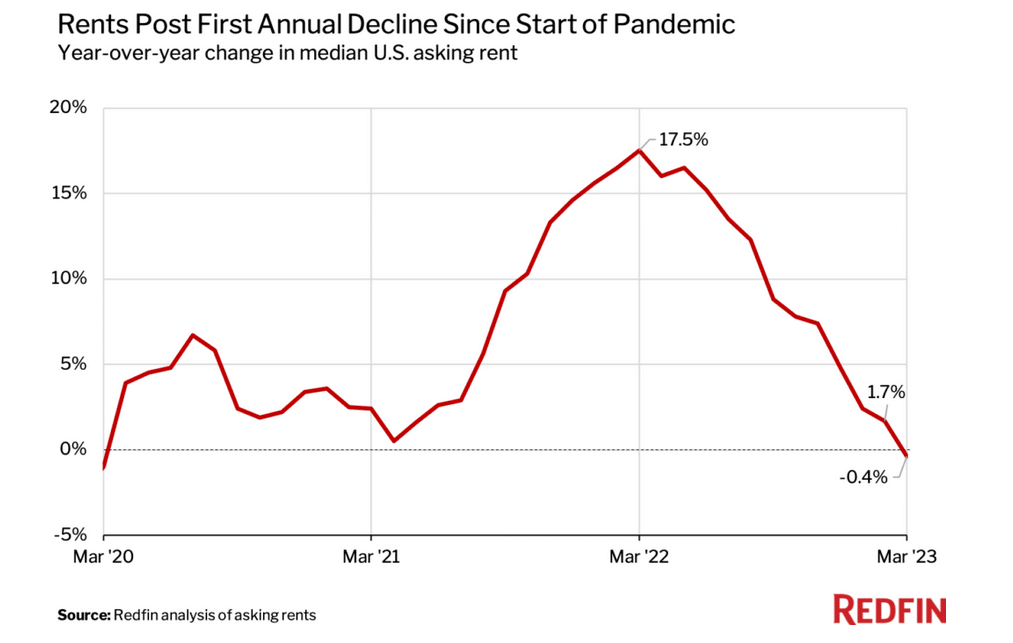
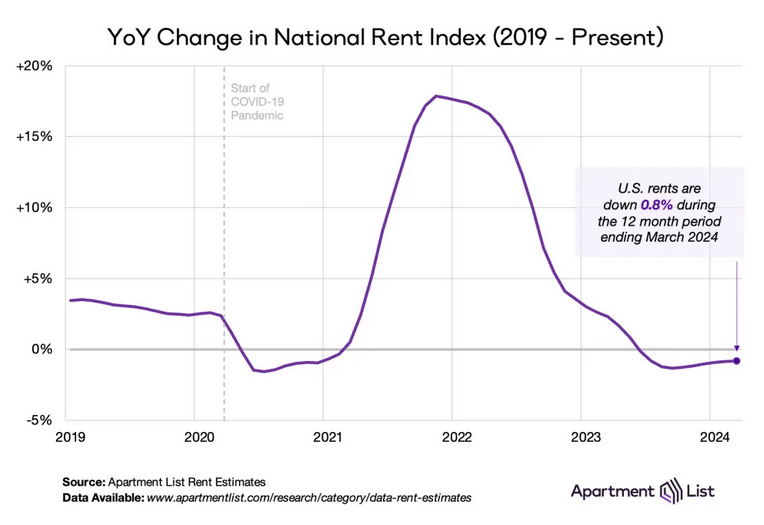
The NTR data is volatile from quarter to quarter, but it is in line with other private measures of rent. For example, the graphs below the scatter plot show that RedFin’s and Apartment List’s proprietary rent price indexes are also declining on a yearly basis.
When CPI Shelter catches up with market prices, we should see inflation figures decline again. With it, we suspect the market will start pricing in more rate cuts for later this year, and the Fed will likely become more dovish.
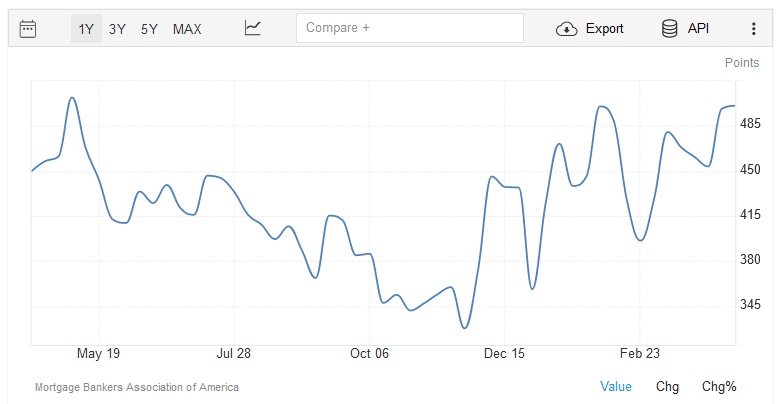
Mortgage Refinancings Are Picking Up…Why?
The Mortgage Bankers Association (MBA) mortgage refinance index just posted its highest point in nearly a year, as shown below. Given that mortgage rates have not fallen significantly, the rise in the index is troubling. Most likely, an increasing number of mortgage holders are draining equity from their houses at higher rates than their prior mortgage rate. Typically, customers would rely on credit cards to meet short-term crunches. Might those be maxed out?
While the refi index has been climbing over the past few months and is near the highs going back to late 2022, it is still well below levels when mortgage rates were much lower. From 1990 to the present, the average for the index is 1844, over three times higher than the current reading.
Tweet of the Day
“Want to achieve better long-term success in managing your portfolio? Here are our 15-trading rules for managing market risks.”
Please subscribe to the daily commentary to receive these updates every morning before the opening bell.
If you found this blog useful, please send it to someone else, share it on social media, or contact us to set up a meeting.
Post Views: 558
2024/04/19