Retail sales by major segment: huge winners (on top: ecommerce and general merchandise retailers), and some big losers.
By Wolf Richter for WOLF STREET.
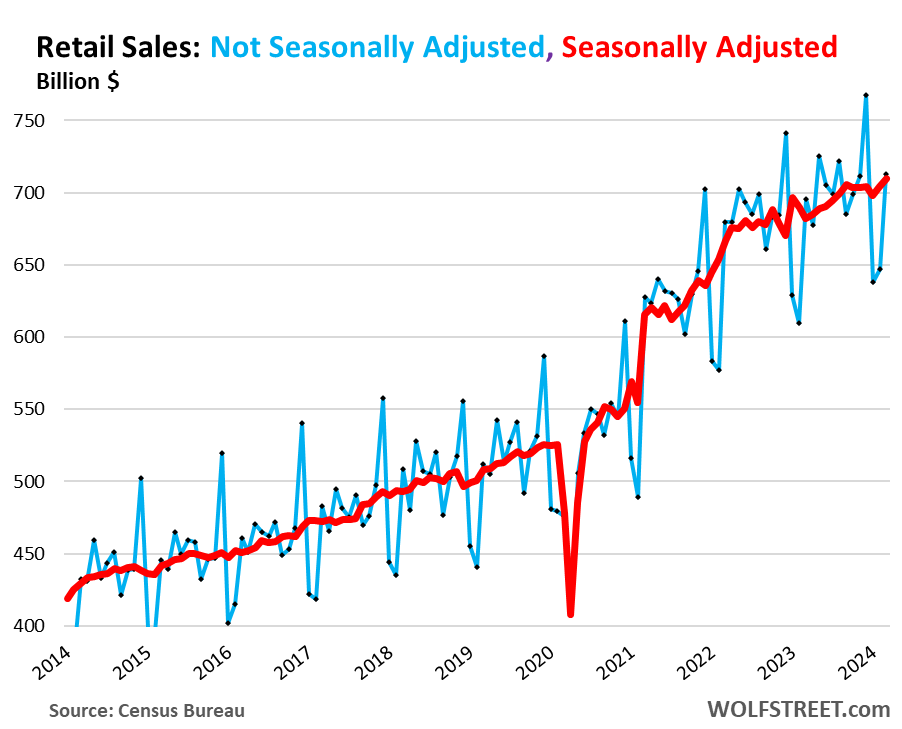
Total retail sales jumped by 0.7% seasonally adjusted in March from February, after having jumped by an upwardly revised 0.9% in February from January (red line in the chart below). Year-over-year, retail sales jumped by 4.0%.
Not seasonally adjusted (blue line), retail sales jumped 10.1% in March from February to $712 billion. We can see what happened: widespread harsh winter conditions in January added to the normal plunge in January from December. This was followed by a strong bounce in February, when normally retail sales fall further. And then in March, there was another strong bounce as is typical.
These increases in sales came despite price decreases in many goods that retailers sell, particularly durable goods – motor vehicles, electronics, appliances, furniture, etc., with prices dropping month-to-month and year-over-year for over a year. But retail sales are from the retailers’ point of view, they’re not adjusted for inflation/deflation, just like Walmart doesn’t adjust quarterly earnings to inflation. Adjusted for the negative inflation rates in many of the goods that retailers sell, retail sales would have jumped even more. And so this data will boost the inflation-adjusted consumer spending and GDP figures nicely.
The biggest drivers of the growth in retail sales on a year-over-year basis were: ecommerce (+11.3% YoY), food services and drinking places (+6.5% YoY), “miscellaneous retailers” which includes cannabis shops (+6.1% YoY), and general merchandise retailers (+5.7% YoY).
Some of the dying brick-and-mortar retailer categories – a phenomenon I’ve called since 2016 the Brick-and-Mortar Meltdown, caused by the shift to ecommerce – continue to suffer from year-over-year declines, including department stores, furniture and home-furnishing stores, and electronics & appliance stores.
Where does this money come from?
And some of this income gets spent, and the rest is saved.
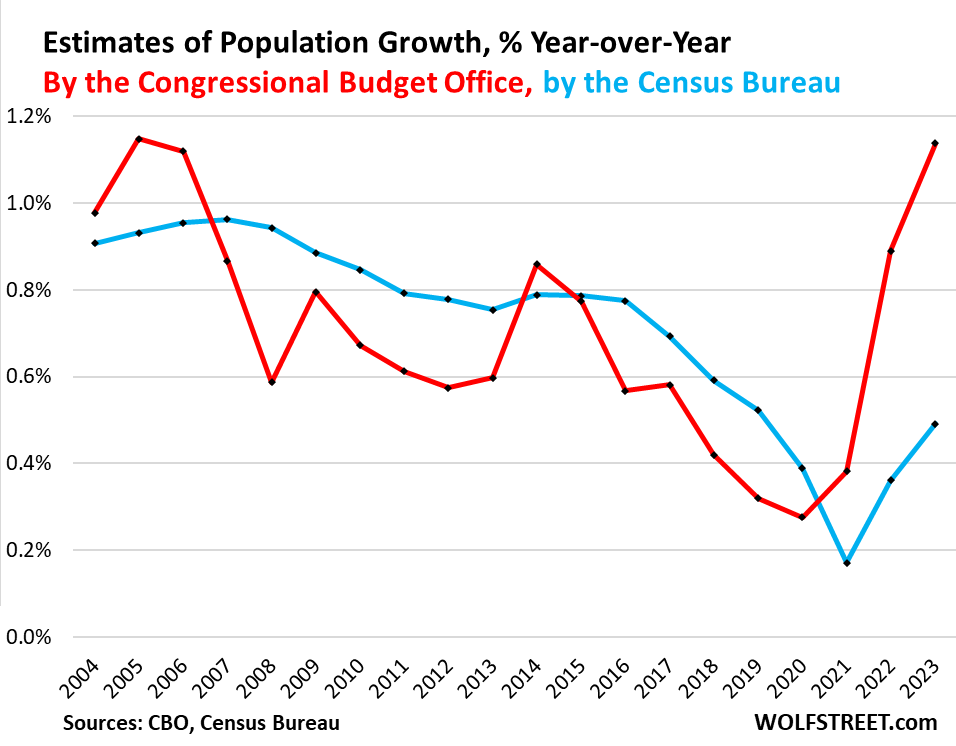
On top of it, there is a huge wave of immigrants, 6 million in 2022 and 2023 combined, according to the CBO (the Census Bureau’s algo however have not yet picked up on the surge in immigrants in 2022 and 2023), and most of these people are quickly joining the labor market, and they’re starting to make money and are spending it. Immigration has caused the US population to grow by 1.14% in 2023, the fastest growth since 2005. These are consumers:
The Fed is watching this nervously.
Back in December, the Fed’s rate-cut views – maybe three in 2024 – were all prefaced by inflation going back toward its 2% target. But now we’ve had the third bad inflation report in a row so far this year, and rate-cut expectations are getting scaled back or are vanishing. And consumers on a buying binge – acting like Drunken Sailors, as we’ve come to call them lovingly and facetiously – are adding to inflationary pressures.
Retail sales by major segment of retailers.
For most charts below, we use the three-month moving average which irons out some of the month-to-month squiggles.
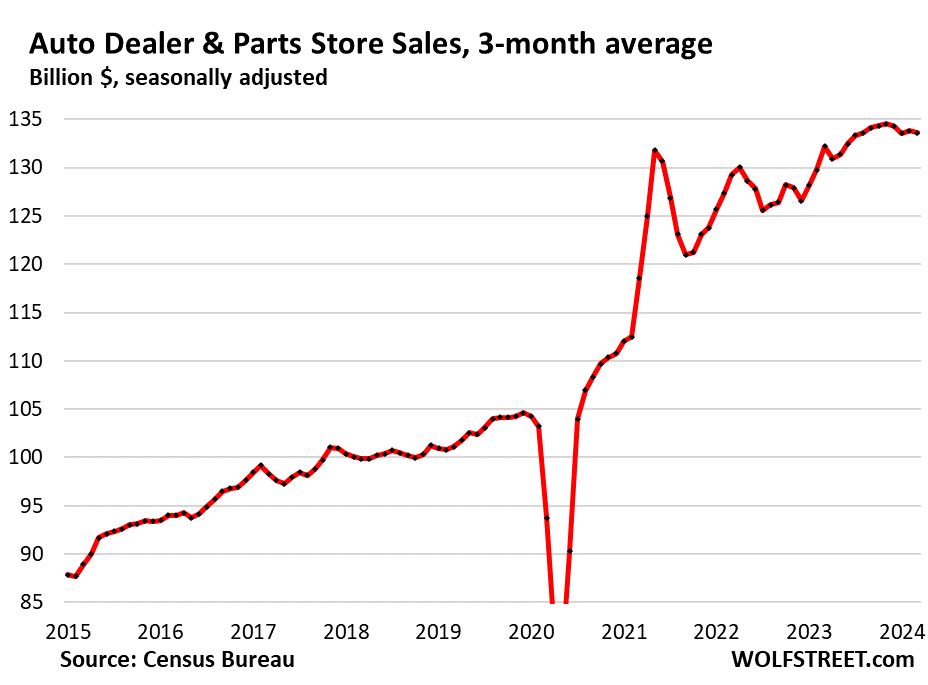
New and Used Vehicle and Parts Dealers (19% of retail trade). These retail sales at auto dealers are in part an expression of the historic price drops in used vehicles that are in the process of unwinding part of their pandemic spike; new vehicle prices also edge down.
- Sales: $134 billion
- From prior month: -0.7%
- From prior month, 3mma: -0.1%
- Year-over-year, 3mma: +1.1% (despite the price drops!)
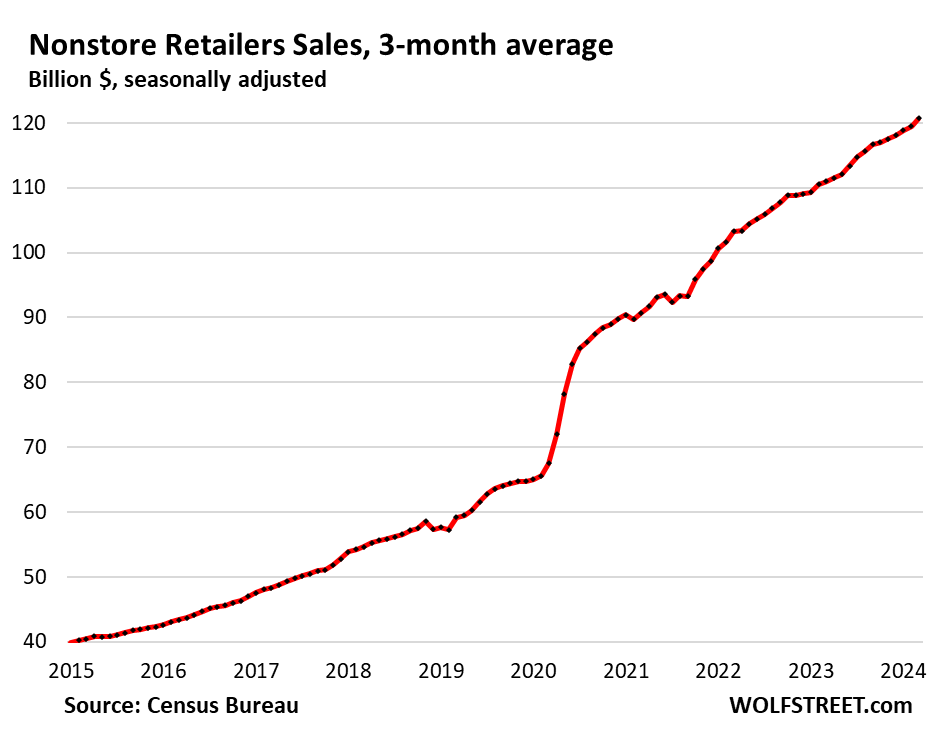
Ecommerce and other “nonstore retailers” (17% of total retail trade), ecommerce retailers, ecommerce operations of brick-and-mortar retailers, and stalls and markets:
- Sales: $123 billion
- From prior month: +2.7%
- From prior month, 3mma: +1.0%
- Year-over-year, 3mma: +8.7%
Bars & restaurants (13% of total retail):
- Sales: $94 billion
- From prior month: 0.4%
- From prior month, 3mma: +0%
- Year-over-year, 3mma: +5.4%
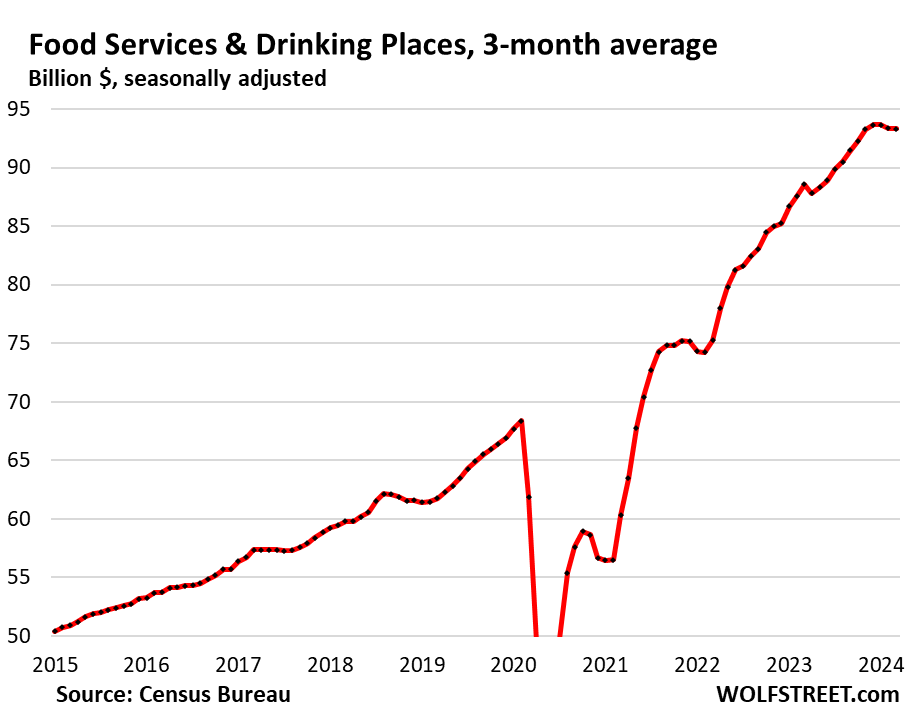
Bars & restaurants, not seasonally adjusted and monthly… In the chart above, the seasonally adjusted three-month average has stagnated with sales at astronomically high levels. But there have been brief flat spots and even dips before as well, and then they were followed by a renewed surge.
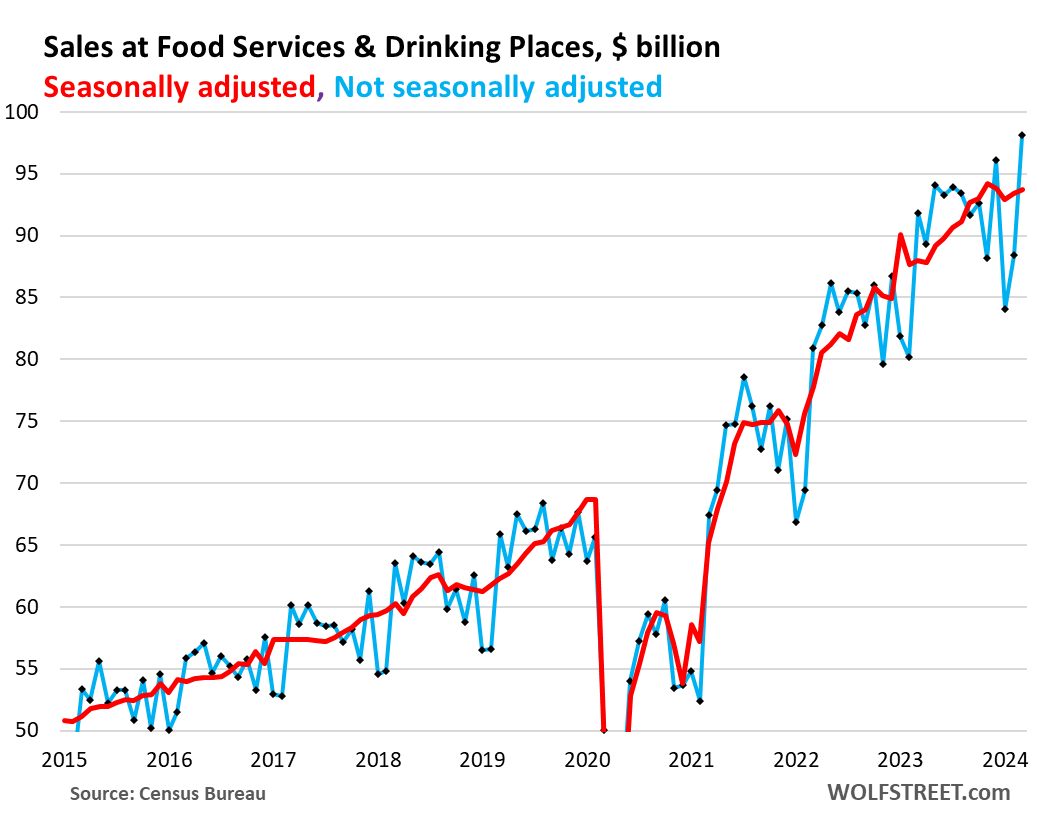
The chart below sheds some light on this. It shows the monthly figures, not three month-averages: seasonally adjusted (red) and not seasonally adjusted (blue).
In the blue line, we can see what happened: perhaps due to bad weather in a big part of the US, sales in January fell more than normal, bounced back some in February, and exploded in March to a new record, with sales up 11% from February, and 6.8% from a year ago. Marches are not the seasonal high of the year, so we can expect further increases in 2024:
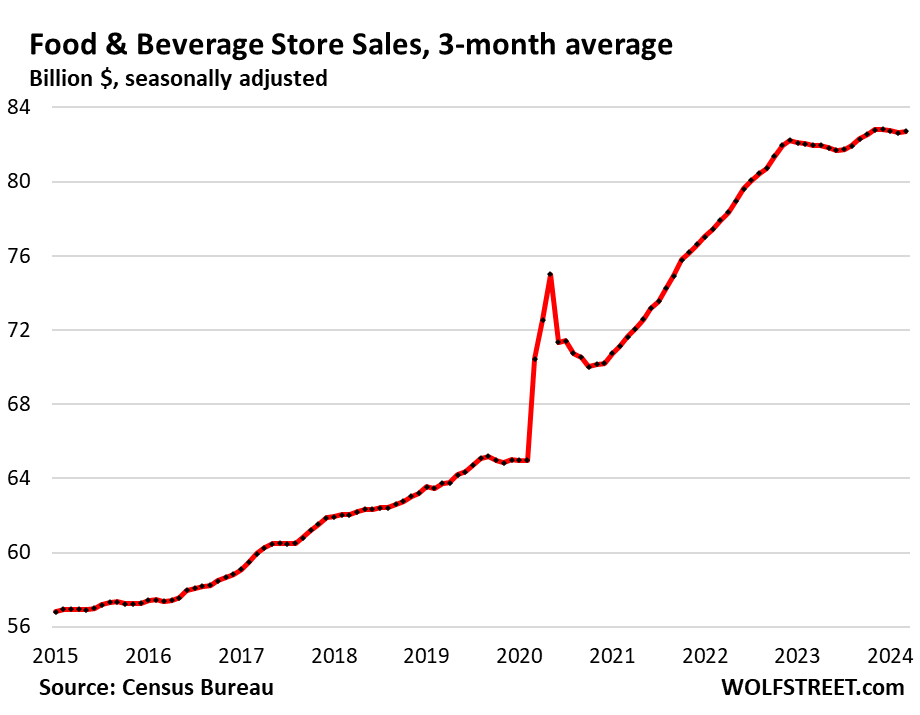
Food and Beverage Stores (12% of total retail):
- Sales: $83 billion
- From prior month: +0.5%
- From prior month, 3mma: +0.1%
- Year-over-year, 3mma: +0.9%
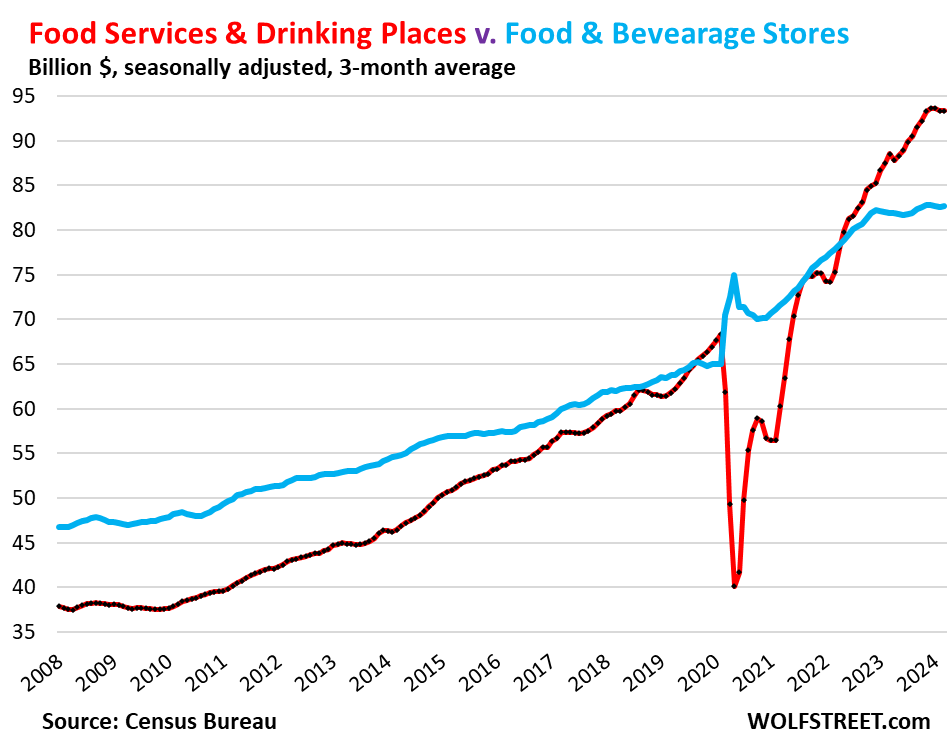
Hallmark of our Drunken Sailors: Americans are now spending vastly more money eating and drinking out than at grocery stores, eagerly paying for the “experience” or the convenience, rather than just the food. They could save a lot of money by eating at home or packing lunch, but no, our Drunken Sailors are going for the experience and the convenience – another sign that they’re flush with money and don’t mind spending it. This is an astounding phenomenon:
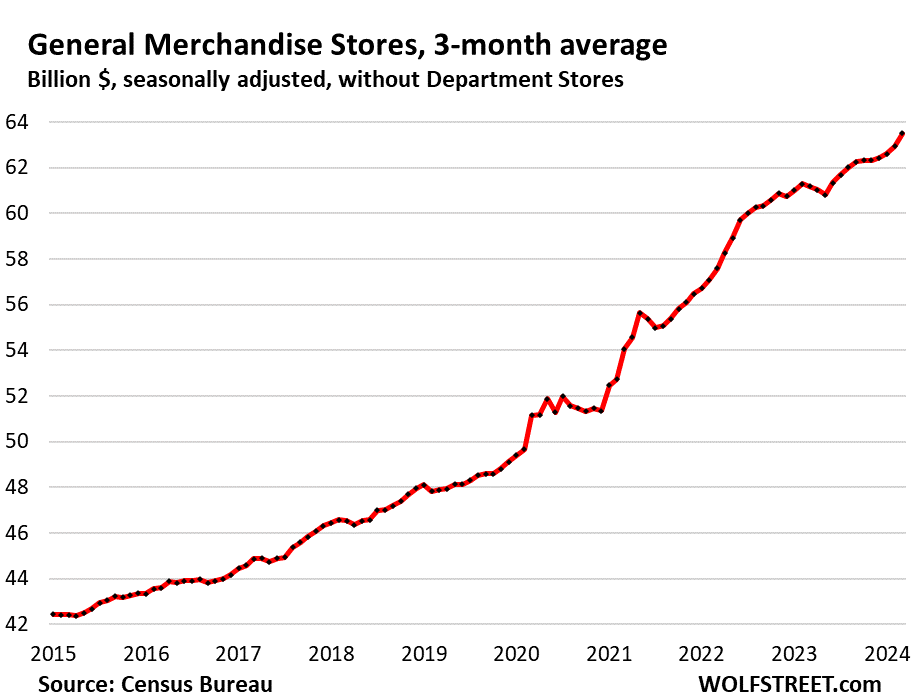
General merchandise stores, without department stores (9% of total retail).
- Sales: $64 billion
- From prior month: +1.5%
- From prior month, 3mma: +0.9%
- Year-over-year, 3mma: +3.8%
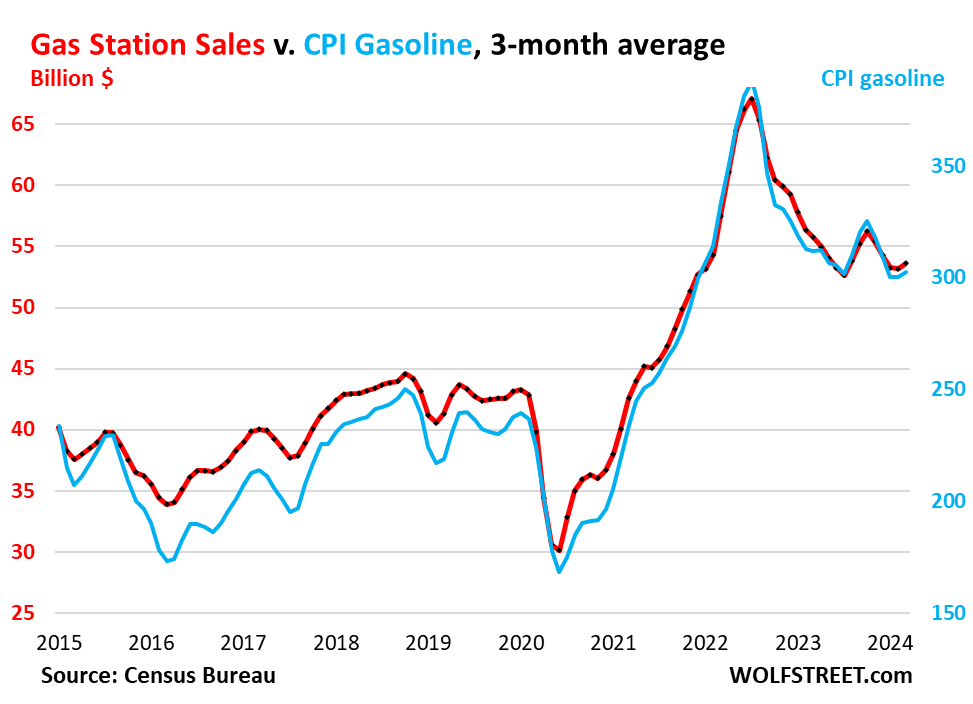
Gas stations (8% of total retail sales). Sales at gas stations move in near-lockstep with the price of gasoline:
- Sales: $55 billion
- From prior month: +2.1%
- From prior month, 3mma: +0.8%
- Year-over-year, 3mma: -3.9%
This chart shows sales in billions of dollars at gas stations, including other merchandise that gas stations sell (red, left axis); and the CPI for gasoline (blue, right axis):
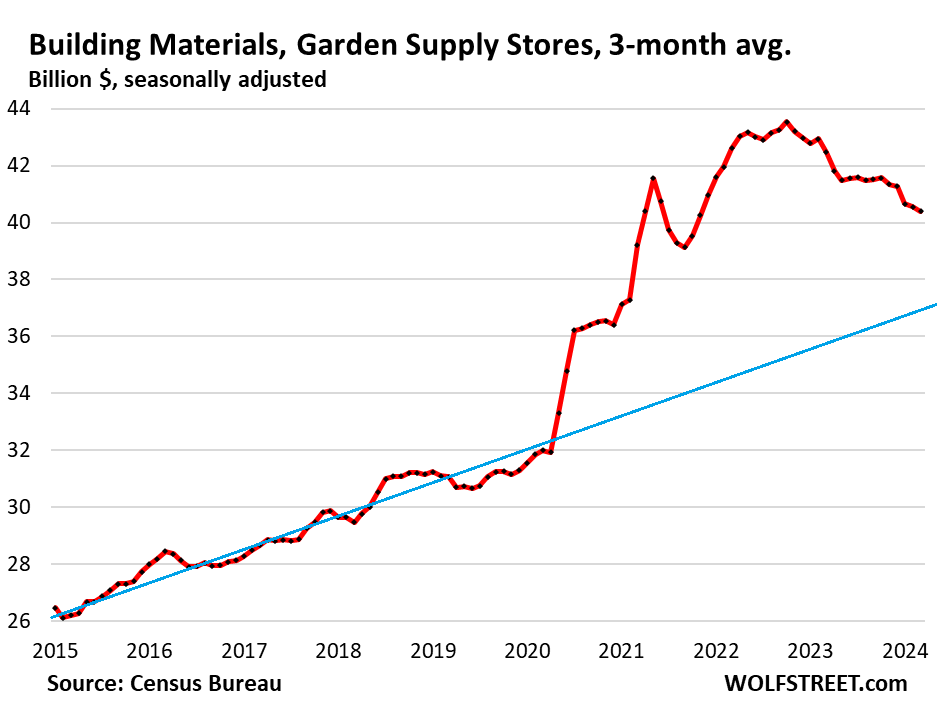
Building materials, garden supply and equipment stores (6% of total retail). Pandemic bubble peaked in October 2022, and then deflated. Just for kicks, we have included a prepandemic trendline:
- Sales: $41 billion
- From prior month: +0.7%
- From prior month, 3mma: -0.4%
- Year-over-year, 3mma: -4.9%
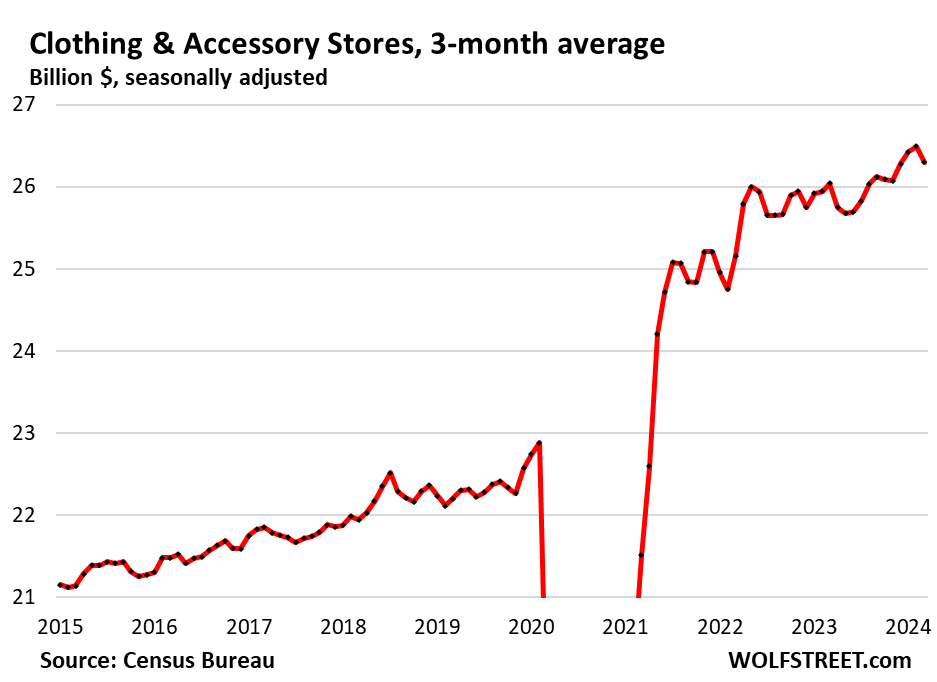
Clothing and accessory stores (3.7% of retail):
- Sales: $26 billion
- From prior month: +1.6%
- From prior month, 3mma: -0.7%
- Year-over-year, 3mma: +1.0%
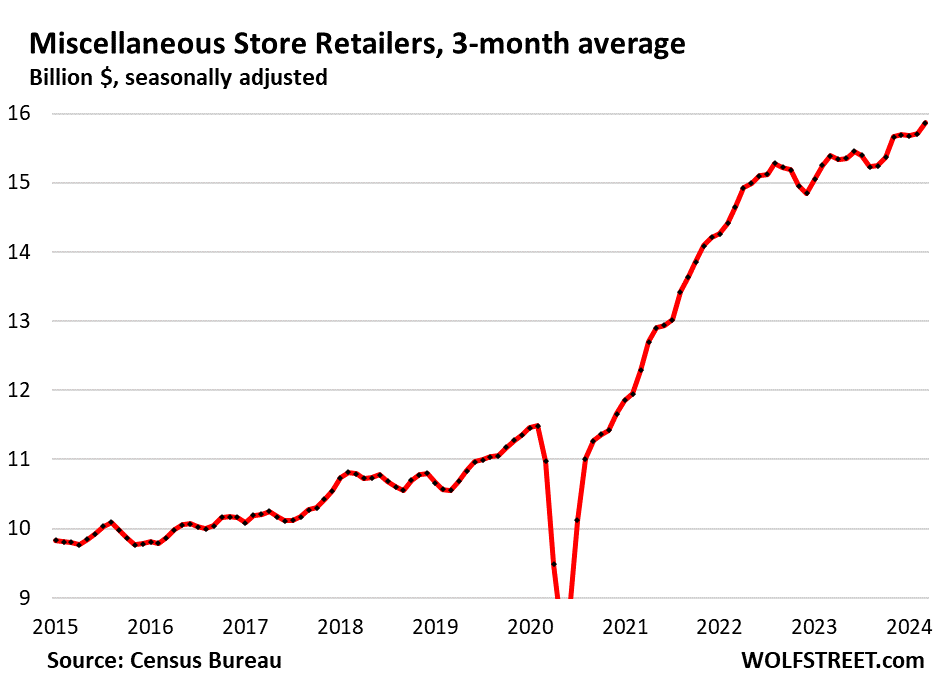
Miscellaneous store retailers (2.2% of total retail): Specialty stores, including cannabis stores.
- Sales: $16 billion
- Month over month: +2.1%
- Month over month 3mma: +1.0%
- Year-over-year, 3mma: +3.1%
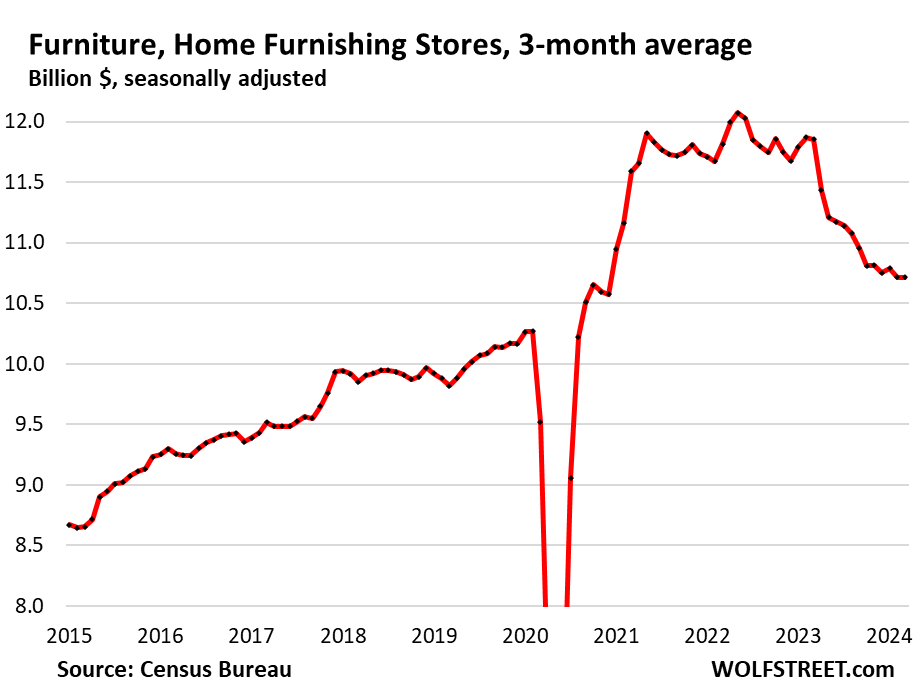
Furniture and home furnishing stores (1.6% of total retail). Much of furniture and furnishing sales have moved to ecommerce. This is what’s left over at brick-and-mortar retailers that specialize in furniture and furnishings:
- Sales: $10.7 billion
- From prior month: -0.3%
- From prior month, 3mma: 0%
- Year-over-year, 3mma: -9.6%.
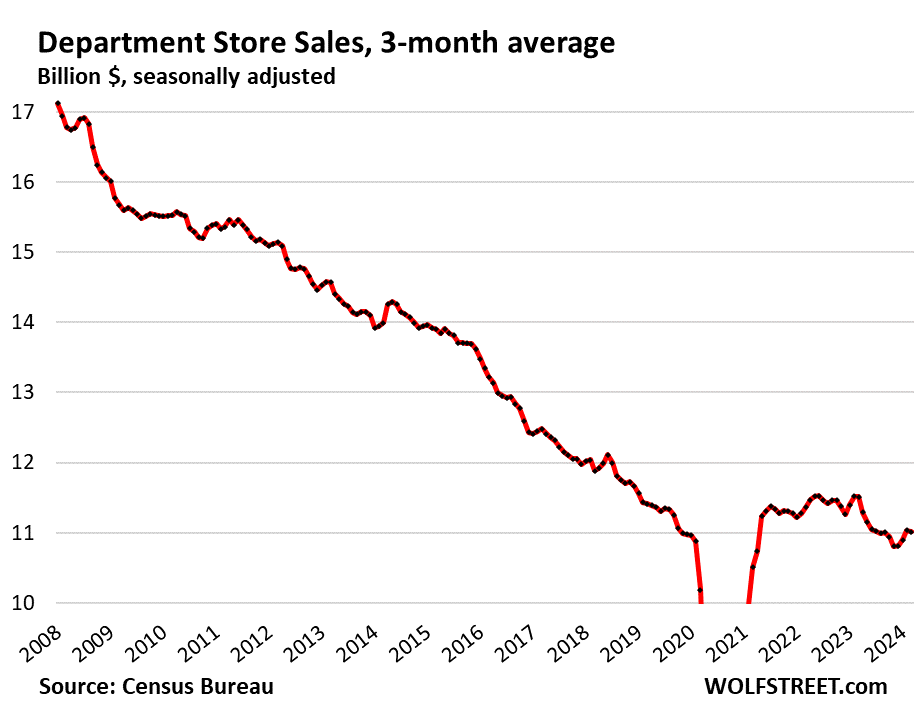
Department stores (now just 1.5% of total retail sales, from around 10% in the 1990s). Ecommerce sales by department store chains are not included here, but are included in ecommerce retail sales above.
- Sales: $10.9 billion
- From prior month: -1.1%
- From prior month, 3mma: -0.2%
- Year-over-year, 3mma: -4.3%
- From peak in 2001: -43% despite 22 years of inflation.
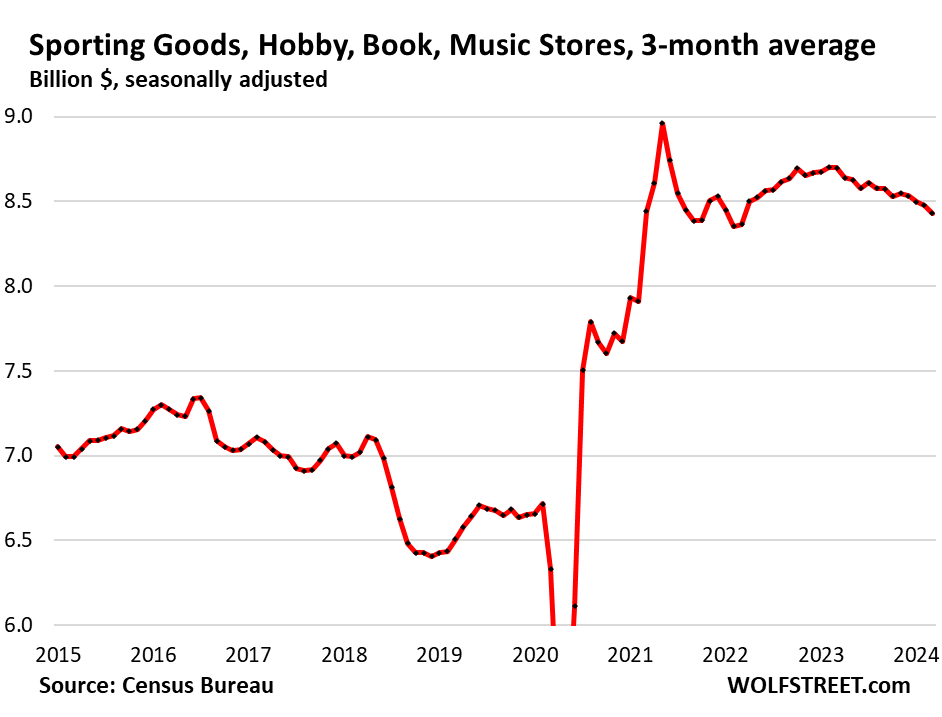
Sporting goods, hobby, book and music stores (1.2% of total retail).
- Sales: $8.4 billion
- Month over month: -1.8%
- Month over month, 3mma: -0.5%
- Year-over-year, 3mma: -3.1%.
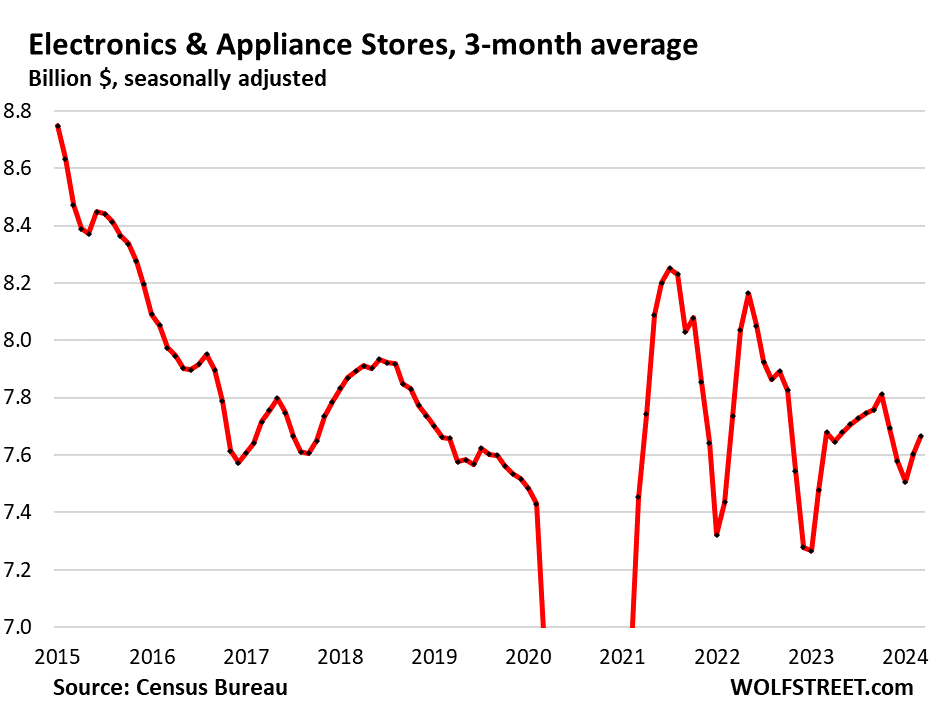
Electronics & appliance stores (1.1% of total retail):
- Sales: $7.6 billion
- Month over month: -1.2%
- Month over month, 3mma: +0.8%
- Year-over-year, 3mma: -0.2%.
Enjoy reading WOLF STREET and want to support it? You can donate. I appreciate it immensely. Click on the beer and iced-tea mug to find out how:

Would you like to be notified via email when WOLF STREET publishes a new article? Sign up here.
![]()