But banks are having profit problems.
By Wolf Richter for WOLF STREET.
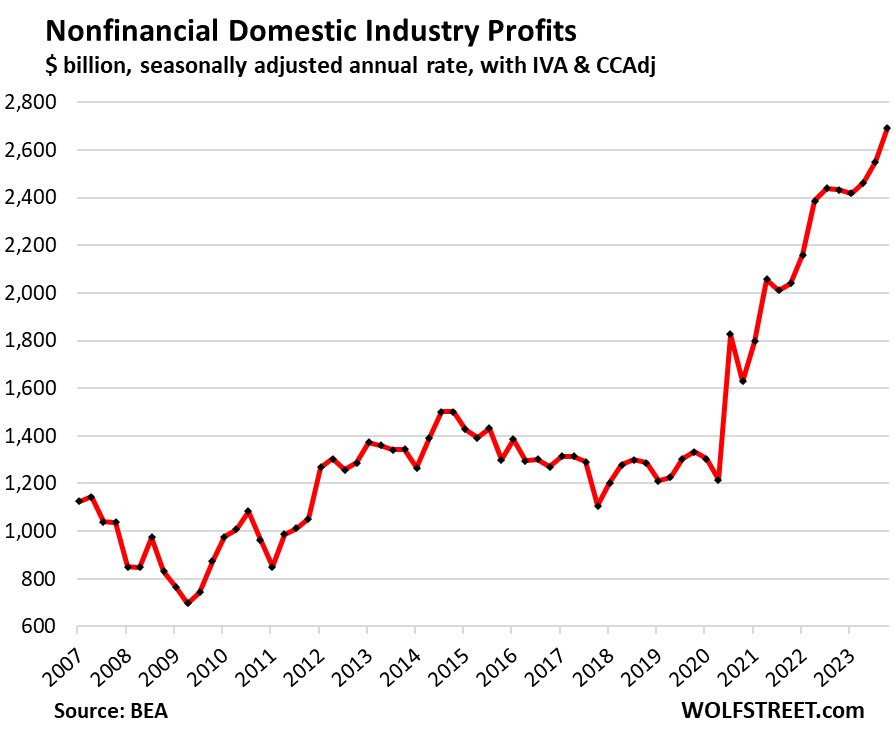
Corporate pre-tax profits in all nonfinancial domestic industries combined – this excludes our suffering banks and other financial companies – jumped by 5.6% in Q4 from Q3, and by 10.7% year-over-year to a record seasonally adjusted annual rate of $2.69 trillion, according to data by the Bureau of Economic Analysis today.
The BEA’s measure of corporate profits tracks “profits from current production” by all businesses that have to file corporate tax returns, including LLCs and S corporations, plus some organizations that do not file corporate tax returns. It’s based on income tax data from the IRS and on financial statement data filed with the SEC.
The re-heating inflation scenario.
As we can see in the chart above: During the inflation surge in 2021 and 2022, corporate profits spiked as price increases were outstripping cost increases, with a huge quarter-to-quarter spike of 10.5% in Q2 2022, which coincided with the peak in core CPI inflation. Then there was a lull in the growth of corporate profits in Q3 2022 through Q2 2023.
But then in Q3 and Q4 2023, it started all over again with big jumps in profits, coinciding with reaccelerating core CPI inflation.
This spike in profitability in inflationary times is a sign that companies hiked prices much faster than their costs – including labor costs – went up, that they were able to do so without losing customers, and that they were confident that they would not lose customers by hiking prices, and thereby doing their part in refueling the inflationary momentum we’ve been seeing for the past few months. Companies are able to do it because their customers are willing and able to pay those prices.
First some definitions.
IVA: The “inventory valuation adjustment” removes “profits” derived from inventory cost changes. Profits derived from inventory cost changes are like a capital gain rather than “profits from current production.”
CCAdj: The “capital consumption adjustment” converts the tax-return measures of depreciation (based on historical-cost accounting) to measures of consumption of fixed capital, based on current cost with consistent service lives and with empirically based depreciation schedules.
Capital gains & dividends received are excluded to show “profits from current production,” rather than financial gains.
Profits by major industry category.
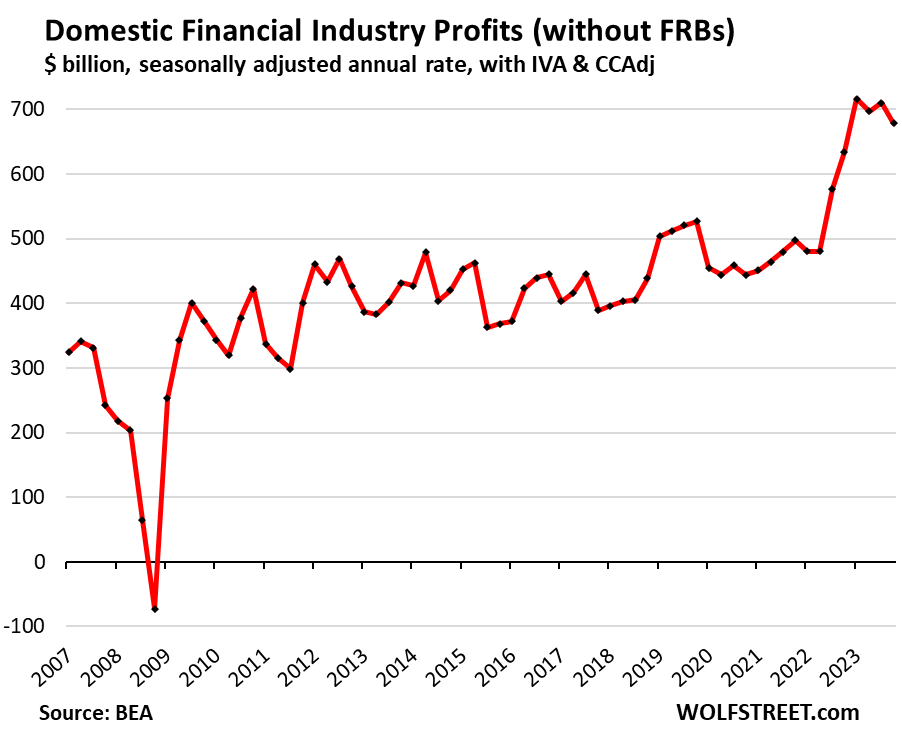
Financial domestic Industries: Profits fell by 4.5% in Q4 from Q3, to a seasonally adjusted annual rate of $679 billion, but was still up 7.0% year-over-year. This was the only major industry where profits fell in Q4.
Banks and bank holding companies are a big part of this industry. Near the end of Q1 2023, the bank panic broke out. And profits began to sag in Q2 2023.
In addition to banks and bank holding companies, the industry includes firms engaged in other credit intermediation and related activities; securities, commodity contracts, and other financial investments and related activities; insurance carriers and related activities; and funds, trusts, and other financial vehicles.
Their customers are paying for those profits by paying higher prices, fees, insurance premiums, etc., which fuel the inflation in services.
Excluded here are the 12 Federal Reserve Banks (FRBs) whose shareholders are the biggest financial institutions in their districts. The Fed has booked $114 billion in losses in 2023, spread over those 12 FRBs, but the losses are irrelevant for corporate profits, they’re a result of the Fed’s paying interest on reserves and ON RRPs. And so we exclude them here.
Despite the decline in profitability, these financial companies are still immensely profitable:
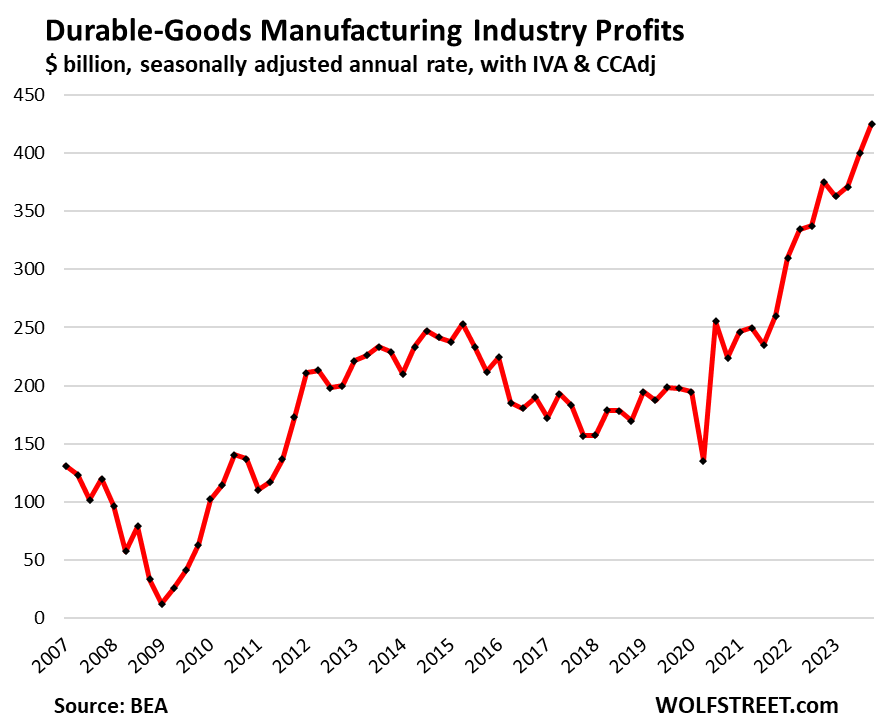
Durable-goods manufacturing: Profits jumped by 6.3% in Q4 from Q3, and by 13.2% year-over-year to a record seasonally adjusted annual rate of $425 billion. Since Q4 2019, profits have spiked by 115%.
These companies produce motor vehicles, trailers, machinery, fabricated metals, computers, electronics, electrical equipment, appliances, components, and other durable goods.
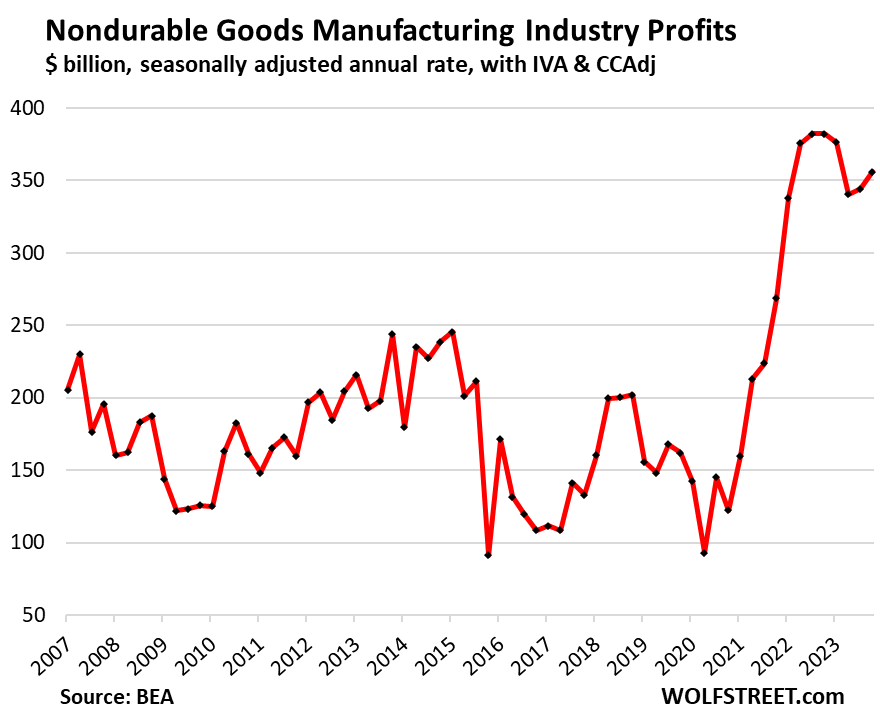
Nondurable-goods manufacturing: Profits rose by 3.5% in Q4 from Q3, to a seasonally adjusted annual rate of $356 billion.
In the first half of 2023, as prices of energy products plunged, so did profits in this industry. And compared to a year ago, profits were still down by 6.9%.
These industries produce food, beverages, petroleum products (including gasoline and diesel), coal products; chemical products; and other nondurable goods.
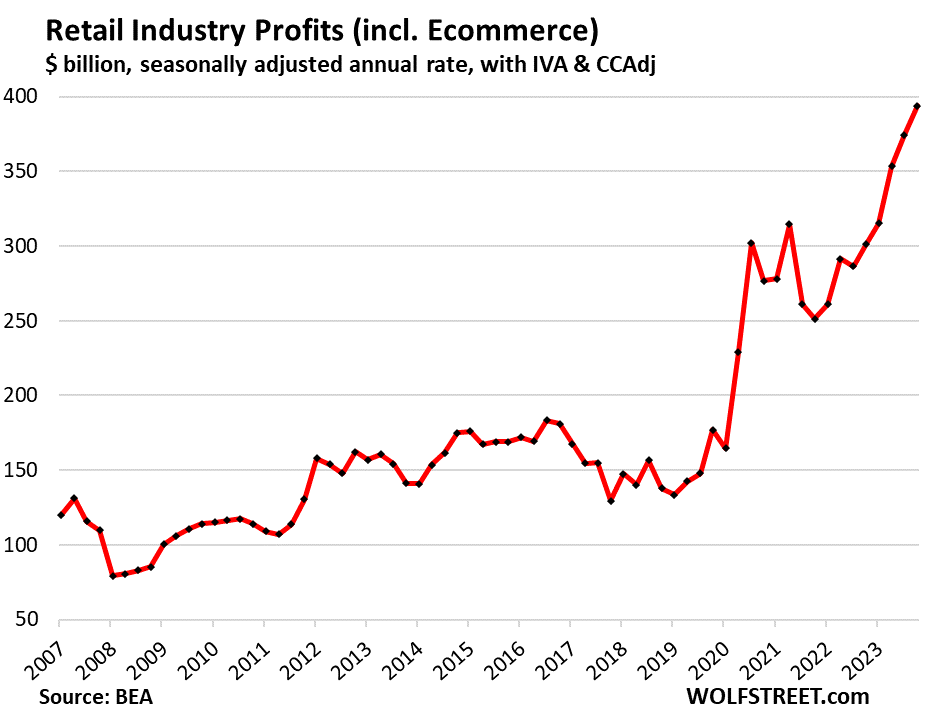
Retail trade, including Ecommerce: Profits spiked by 5.2% in Q4 from Q3 and by 30.6% year over year, to a record seasonally adjusted annual rate of $394 billion.
For the retail industry, including ecommerce, inflation is a massive profit-generator when consumers are willing and able to pay these whatever-prices after the inflationary mindset has set in where companies are confident that they can raise their prices faster than their costs go up, knowing that consumers will pay those higher prices, and that they will not lose sales after having raised their prices:
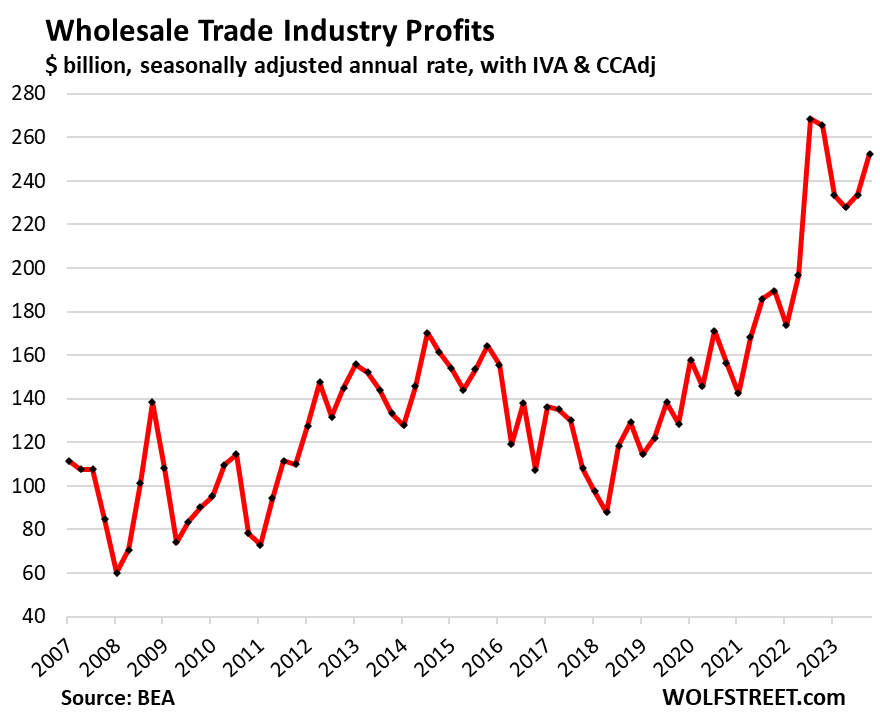
Wholesale trade: Profits rebounded by 8.1% in Q4 from Q3, after the slump that had started at the end of 2022, to a seasonally adjusted annual rate of $252 billion. Compared to a year ago, profits were down by 4.9%:
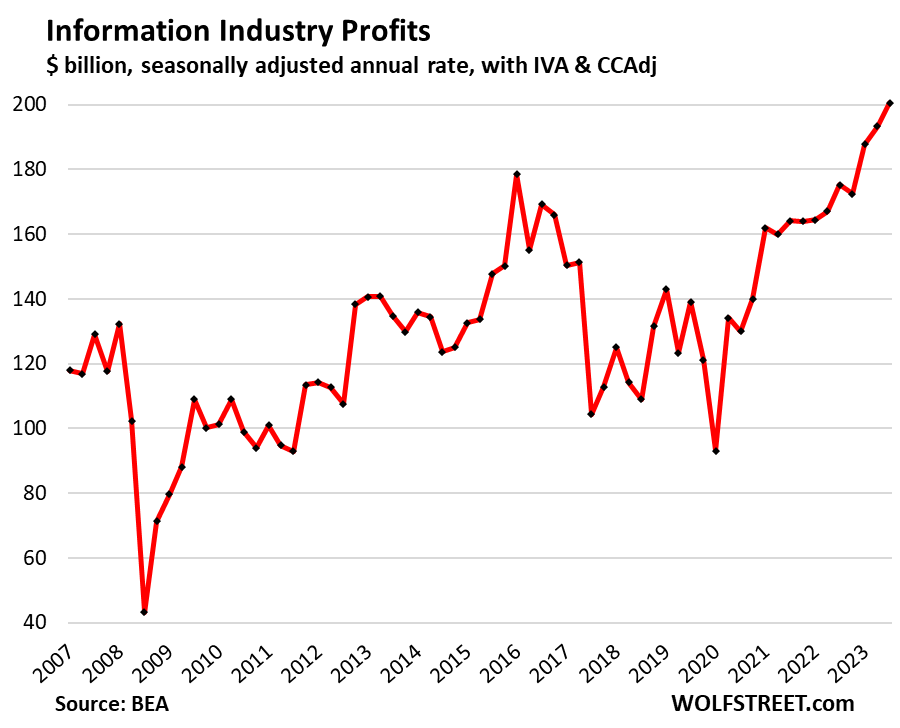
Information: Profits jumped by 3.8% in Q4 from Q3 and by 14.4% year-over-year, to a record seasonally adjusted annual rate of $201 billion. The layoffs in 2022 and early 2023, dumping office real estate, and other cost cuts likely helped boost those profits.
Despite its small size – with about 3 million employees – the sector is generates huge profits. It includes web search portals, data processing, data transmission, information services, software publishing, motion picture and sound recording, broadcasting including over the Internet, and telecommunications.
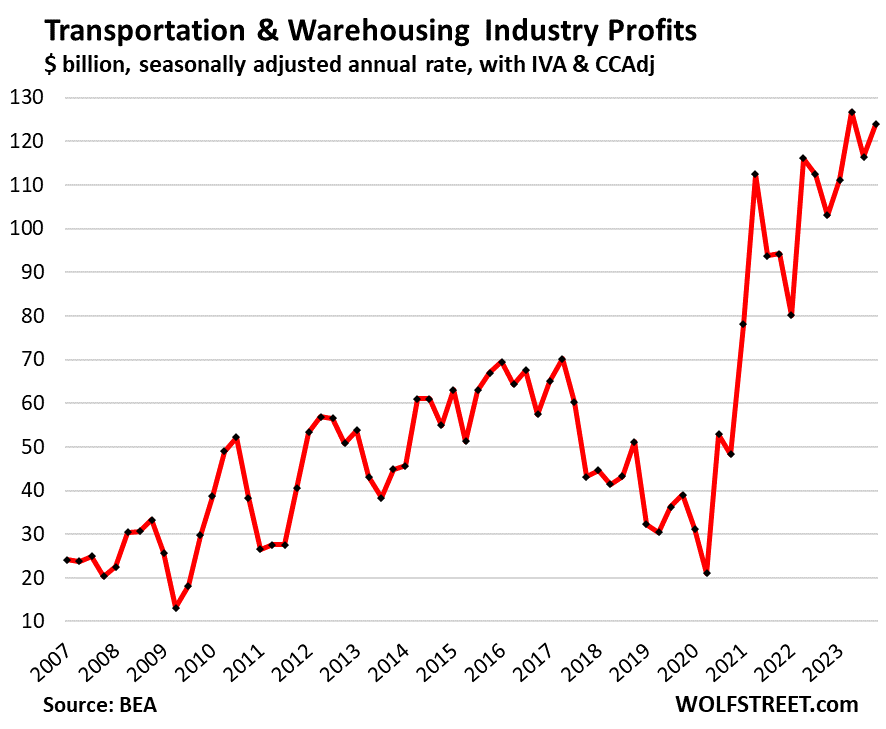
Transportation & warehousing: Profits rebounded by 6.4% in Q4 from Q3, after the drop in the prior quarter, to a seasonally adjusted annual rate of $123 billion. Year-over-year, profits spiked by 20.2%.
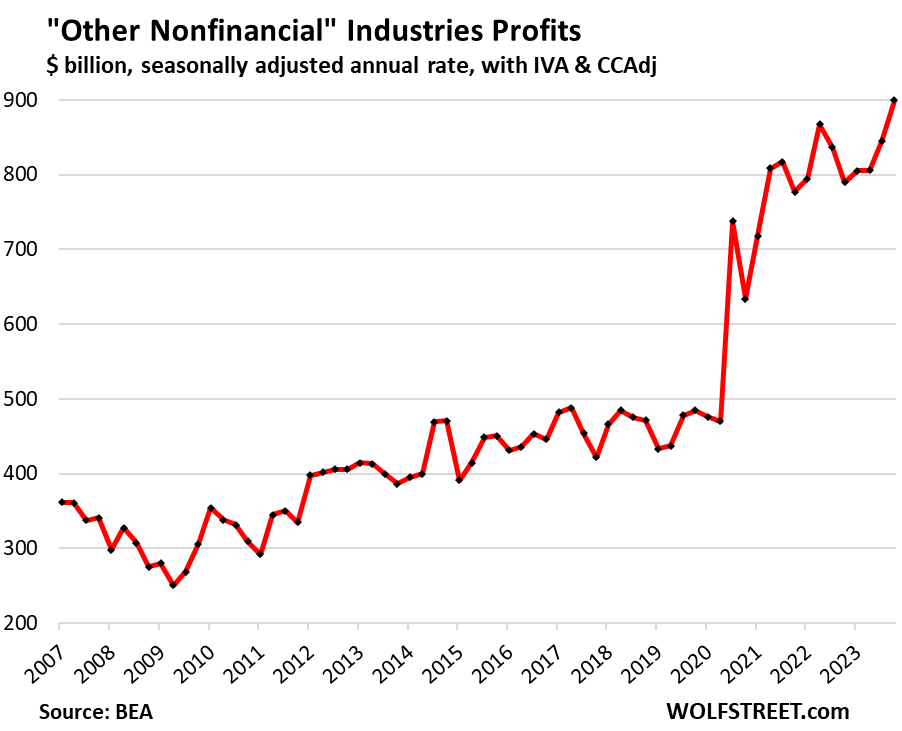
“Other nonfinancial” industries: Profits in this huge catch-all category that includes all the companies not included in the categories above – the largest category here in terms of profits – spiked by 6.5% in Q4 from Q3, and by 13.9% year-over-year, to a record seasonally adjusted annual rate of $900 billion.
The category includes companies in mining; construction; real estate and rental and leasing; professional, scientific, and technical services (where some of the tech and social media companies are); administrative and waste management services; educational services; health care and social assistance; arts, entertainment, and recreation; accommodation and food services; agriculture, forestry, fishing, and hunting; and other services, except government.
Enjoy reading WOLF STREET and want to support it? You can donate. I appreciate it immensely. Click on the beer and iced-tea mug to find out how:

Would you like to be notified via email when WOLF STREET publishes a new article? Sign up here.
![]()